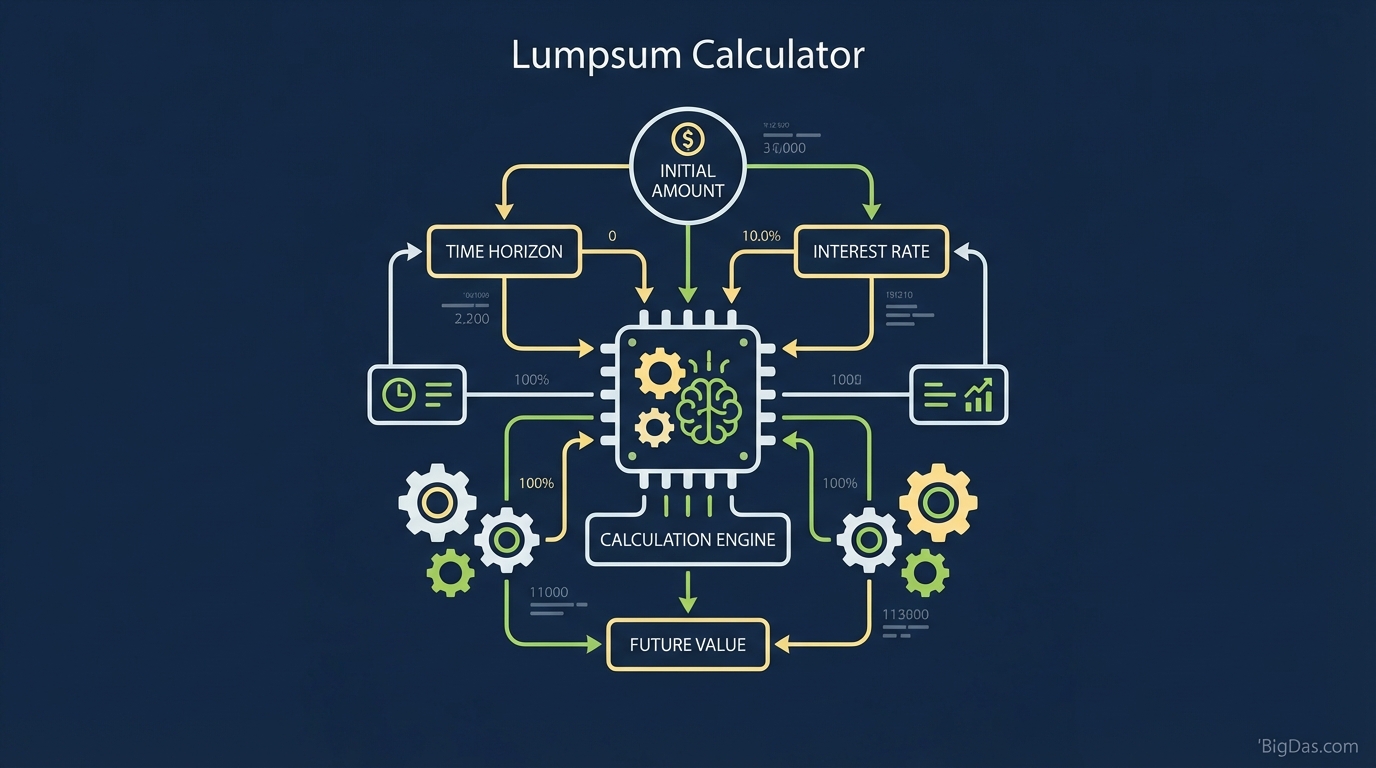
Lumpsum Calculator
 Modern scientific illustration of Lumpsum Calculator
Lumpsum Calculator Guide: How to Project One-Time Investment Returns
A lumpsum investment puts a fixed amount of capital to work at a set rate of return for a defined period. The math is straightforward, but the size of the final number often surprises people. Exponential growth is hard to estimate mentally, which is where a calculator helps.
This guide covers the future value formula, how to use the tool, and the assumptions behind the output.
What is a Lumpsum Calculator?
A Lumpsum Calculator computes the future value of a one-time investment using compound interest.
A Systematic Investment Plan (SIP) spreads contributions across months or years. A lumpsum investment deploys the full amount on day one. The calculator shows what that amount becomes at the end of the investment horizon.
The Formula
The calculator uses the standard Future Value (FV) formula:
FV = PV × (1 + r)^n
- FV: Future Value (the final amount).
- PV: Present Value (your lumpsum investment).
- r: Annual Rate of Interest (expected return).
- n: Number of years invested.
The Compounding Effect
The variable "n" is where most of the growth comes from. Each year, you earn interest on both the original principal and the interest already accumulated. Over long horizons, this effect dominates the final value. The calculator separates Total Investment from Total Earnings so you can see the split.
Key Features
1. Instant Calculation
The tool performs the FV calculation in real time, removing the need to compute powers manually.
2. Visual Growth Chart
A chart plots the year-by-year balance. The gap between the principal line and the total value line makes the compounding effect visible.
3. Scenario Comparison
Adjust the rate, principal, or duration to see how the output changes. This is useful for comparing conservative vs. aggressive return assumptions or short vs. long horizons.
4. Nominal Returns
The output is in nominal terms (not inflation-adjusted). See the FAQ for the manual adjustment.
How to Use the Lumpsum Calculator
Step 1: Enter the Investment Amount
Input the total capital you are investing today.
- Note: Use money you won't need to withdraw. Lumpsum investing requires the capital to stay invested for the full horizon to work as modeled.
Step 2: Set the Expected Rate of Return
Pick a rate that matches the asset class:
- Fixed Deposits / Bonds: 5%-7% (low risk).
- Equity Mutual Funds / Index Funds: 10%-14% (higher risk, historically higher returns).
- Real Estate: Variable, depending on location and leverage.
- Tip: If you expect 12%, model 10%. A conservative input gives you a more realistic floor.
Step 3: Set the Time Horizon
Enter the number of years you plan to stay invested.
- Rule of thumb: Time in the market matters more than timing the market. A few extra years usually outweighs a slightly better entry point.
Step 4: Read the Output
The tool returns two figures:
- Estimated Returns: Profit only.
- Total Value: Principal plus profit.
The chart shows when interest earnings exceed the original principal, often called the "tipping point."
Common Use Cases
1. Retirement Planning
A $50,000 investment at 12% over 30 years grows to roughly $1.5 million. Running this number makes the long-term cost of spending a windfall easier to evaluate.
2. Windfall Allocation
Inheritances, bonuses, and property sales create sudden liquidity. The calculator helps assign a target value to a portion of the windfall before you allocate it elsewhere.
3. Goal-Based Planning
- Education: Will $20,000 today cover tuition in 15 years?
- Home Down Payment: How long until $10,000 doubles?
Set the target amount, adjust the rate, and read the required duration off the output.
4. Comparing Asset Classes
Run the same principal and horizon twice, once at 6% (bonds) and once at 10% (equities). The spread over 20 years is typically six figures, which makes the long-term cost of staying in low-yield assets concrete.
Practical Notes for Lumpsum Investing
1. Don't Withdraw Early
The model assumes the full amount stays invested. Withdrawals during a downturn break the compounding chain and reduce the final value.
2. Entry Point Matters Less Than Duration
Over 10 to 15+ year horizons, the difference between investing at a market peak and a market trough tends to shrink. Extending the horizon by 2 to 3 years often compensates for a lower rate or a poor entry.
3. Taxes Reduce the Net Figure
The calculator shows Gross Returns. Capital gains tax applies on top in most jurisdictions. If your goal is a specific after-tax amount (e.g. $500,000 for a home), model a higher target (e.g. $550,000) to cover the tax drag.
Frequently Asked Questions (FAQ)
1. How accurate is this Lumpsum Calculator?
The math is exact for the inputs you provide. The model assumes a constant annual return, which real markets don't deliver. Treat the output as a close estimate, not a guarantee.
2. Lumpsum vs. SIP: Which is better?
They serve different purposes.
- Lumpsum fits investors with a large amount of cash available now who want maximum compounding.
- SIP fits salaried investors building a position monthly and averaging out volatility through rupee cost averaging.
- Note: When the cash is already available, lumpsum mathematically beats SIP over the same horizon because the full principal earns returns from day one.
3. Does the calculator account for inflation?
No. The output is Nominal Returns. To estimate the inflation-adjusted value, subtract the expected inflation rate from your expected return.
- Example: 12% expected return minus 4% inflation = input 8% to see the "real" value in today's purchasing power.
4. Can I use this for crypto or real estate?
Yes. The compound growth formula applies to any asset. Estimate the Annualized Growth Rate (CAGR) for the asset and input it as the rate.
Lumpsum investing rewards patience and a realistic return assumption. Run your numbers, compare a conservative and an aggressive case, and use the result as a planning baseline rather than a forecast.