
GDP Per Capita by Country

Global Wealth Rankings: GDP Per Capita by Country
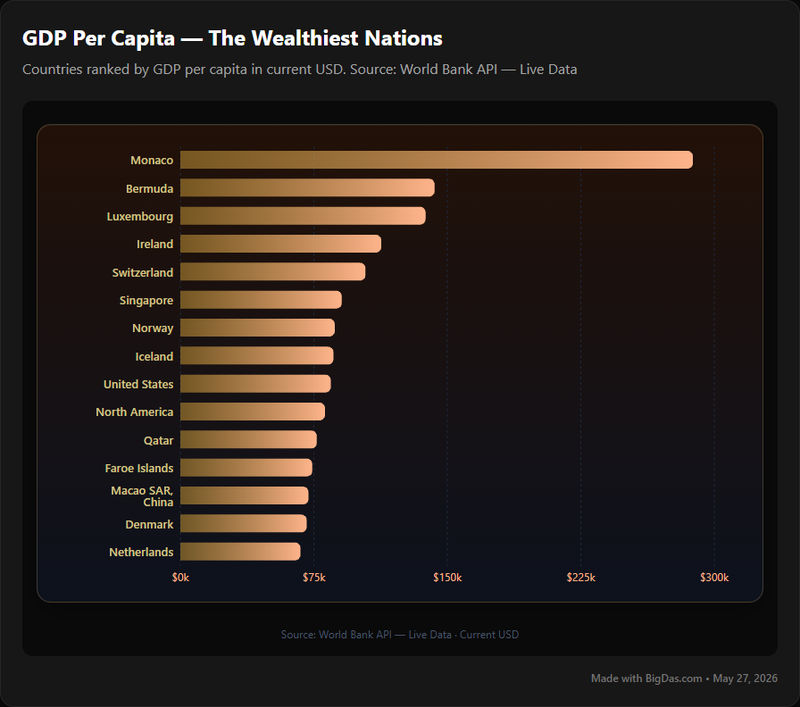
Gross Domestic Product (GDP) per capita is a standard metric for comparing the economic output and average prosperity of nations. The "GDP Per Capita by Country" tool ranks the world's wealthiest countries by this measure in current USD, providing a direct view of global economy and wealth distribution.
What is GDP Per Capita?
GDP per capita measures the average economic output per person in a country. It divides total GDP by total population, converting an aggregate economic figure into a per-person indicator of prosperity.
Gross Domestic Product (GDP)
GDP is the total monetary value of all finished goods and services produced within a country's borders over a set period, usually one year. It is calculated using one of three approaches:
- Expenditure Approach: Total spending in the economy (consumption, investment, government spending, net exports).
- Income Approach: Total income earned in the economy (wages, rent, interest, profits).
- Production Approach: Value added at each stage of production.
Why "Per Capita" Matters
Total GDP reflects the size of a country's economy, but it ignores population. A large economy with a large population can have a lower per-person figure than a smaller economy with fewer people. GDP per capita corrects for this by averaging output across the population, giving a better proxy for the average standard of living.
For example, two countries with similar total GDPs will have different GDP per capita figures if their populations differ. The country with fewer people will have a higher per capita value, indicating that its citizens benefit from a greater share of national output.
Current USD, Nominal GDP, and PPP
The tool ranks countries using current USD. This means values are expressed in nominal U.S. dollars at prevailing exchange rates, without inflation adjustment.
- Current USD: Direct, apples-to-apples comparisons using market exchange rates. Suitable for international financial comparisons and ranking absolute wealth.
- Nominal vs. Real GDP: Nominal GDP uses current prices and exchange rates. Real GDP adjusts for inflation. The tool uses nominal values for straightforward ranking.
- PPP (Purchasing Power Parity): Adjusts for differences in cost of living across countries. PPP-adjusted figures better reflect what money buys domestically, but "current USD" is preferred for measuring international economic size and wealth in absolute terms.
The tool uses current USD because it offers a universal, comparable metric for ranking national economy size and per-person output.
Features of the Tool
Country Rankings: A ranked list of countries by GDP per capita, sorted from highest to lowest for immediate comparison.
Current USD Data: Values are in nominal U.S. dollars based on the most recent available data, allowing direct comparison of the global economy.
Clear Data Presentation: Information is structured for readability, using tables and standard formatting so users can quickly interpret economic statistics.
Sorting and Filtering (where available): Users can sort by country name, GDP per capita, or population, and filter by continent, economic bloc, or income group for focused analysis.
Data Export (where available): Data can typically be downloaded in CSV or Excel format for further analysis in spreadsheets or research projects.
Historical Data (where available): Some versions of the tool provide historical figures, allowing users to track changes in GDP per capita over time and identify growth or decline patterns.
Benefits
- Comparative Analysis: Benchmark national economies and identify regional leaders or disparities.
- Standardized Data: A single source for GDP per capita in a consistent format, reducing discrepancies from multiple datasets.
- Decision Support: Investors, businesses, and policymakers can assess markets, risk, and development priorities.
- Education: Students and educators can use the data to study international economy, geography, and inequality.
- Trend Tracking: Historical views reveal economic growth, stagnation, or decline over time.
- Global Awareness: General users gain a clearer picture of how countries compare economically.
- Time Savings: Centralized, standardized data removes the need to compile figures from multiple sources.
How to Use the Tool
Step 1: Access the Tool
Go to the page hosting the "GDP Per Capita by Country" tool. The default view typically shows a ranked list sorted by GDP per capita from highest to lowest.
Step 2: Read the Interface
Common elements include:
- Columns: Country name, GDP per capita (current USD), and possibly rank, population, or region.
- Search Bar: Locate a specific country.
- Sortable Headers: Click column headers to sort alphabetically or by value.
- Filters: Narrow by region, income group, or other criteria.
- Year Selector (if available): Choose historical years.
Step 3: Identify the Top Rankings
The default ranking places the wealthiest countries at the top. Skim the top entries to see which nations lead in average individual wealth.
Step 4: Customize the View
- Sort by Country Name: Alphabetical order for finding specific nations.
- Sort Ascending: View the lowest GDP per capita figures first.
- Filter by Region: Limit the list to a continent for regional comparison.
- Filter by Income Group: Use World Bank classifications (high, upper-middle, lower-middle, low income) to analyze development stages.
- Filter by Population: See how population size affects per capita wealth.
Step 5: Interpret the Results
- Look for Outliers: Identify countries that break regional or income-group patterns.
- Track Changes (if historical data exists): See whether GDP per capita is rising, flat, or falling.
- Add Context: GDP per capita is an average. Income inequality, cost of living, political stability, and social services all affect actual quality of life.
Step 6: Export and Analyze Further
If export is available, download the filtered dataset for use in spreadsheets, reports, or combined analysis with other economic or social data.
Use Cases
Economists, Researchers, and Students
- Compare economic performance and living standards across countries and regions.
- Track convergence or divergence in GDP per capita over time.
- Use the tool as a baseline data source for studies on international economy, development, and inequality.
Investors and Financial Analysts
- Identify markets with high purchasing power and consumer strength.
- Assess economic stability and resilience before investing.
- Diversify portfolios across countries with different wealth profiles.
- Spot emerging markets based on rising GDP per capita.
Policymakers and Government Agencies
- Target development aid to countries with the greatest need.
- Inform trade policy using knowledge of partner economies.
- Shape immigration and labor policies based on economic disparities.
- Benchmark national performance against peers.
Businesses and Market Entry Strategists
- Estimate market size and purchasing power in target countries.
- Tailor products and pricing to local income levels.
- Identify locations with developed workforces for international operations.
Educators and Geography Students
- Teach economic inequality and wealth distribution in context.
- Build case studies around specific country rankings.
- Use the visual rankings to make lessons on the global economy and geography more concrete.
General Users and Travelers
- Build a clearer picture of global economic conditions.
- Use GDP per capita as a rough reference for cost of living in destination countries.
- Add context to international news by understanding a country's economic standing.
Frequently Asked Questions
What are the main limitations of GDP per capita?
- Income Inequality: It is an average and ignores how wealth is distributed.
- Non-Market Activities: It excludes unpaid work, informal economy activity, and subsistence farming.
- Quality of Life: It does not measure health, education, environment, leisure, political freedom, or happiness.
- Externalities: Spending on pollution cleanup adds to GDP but represents a cost, not a benefit.
- Cost of Living: Current USD does not adjust for purchasing power; PPP-adjusted figures are better for that purpose.
- Resource Depletion: It does not account for the depletion of natural resources or capital depreciation.
How is GDP per capita calculated?
GDP per capita equals total GDP divided by total population.
Formula:
GDP Per Capita = Total GDP / Total Population
Total GDP is usually measured in local currency and converted to USD at market exchange rates for current-USD figures.
Why use current USD instead of PPP?
Current USD provides a direct, consistent comparison using global market exchange rates. It reflects a country's economic output as valued on international markets and is standard for rankings based on absolute economic size.
PPP adjusts for differences in cost of living and shows what money actually buys within each country. It is better for comparing living standards, but it does not reflect market exchange rates. For rankings focused on absolute output and international financial comparisons, current USD is the standard.
Does a high GDP per capita mean a high quality of life?
Not always. High GDP per capita usually correlates with better access to goods, services, education, and healthcare, but it does not guarantee a high quality of life. Income inequality, environmental degradation, social stress, and political conditions all matter. Indices like the Human Development Index (HDI) and the World Happiness Report incorporate these factors alongside income.
How often is the data updated?
Most tools update annually, drawing from official sources such as the World Bank, IMF, and United Nations. There is typically a lag of several months to a year between the end of the reporting period and the publication of finalized, internationally comparable data. Reputable tools list their sources and the last update date.
Conclusion
The "GDP Per Capita by Country" tool ranks nations by average economic output per person in current USD, giving a standardized view of global wealth and economy size. It supports comparison, trend tracking, and decision-making for economists, investors, policymakers, businesses, educators, and general users. By presenting per capita figures in a consistent format, the tool provides a practical reference for understanding where economic output is concentrated and how countries compare on a per-person basis.