
Global Food Production

Unveiling Global Food Production: Your Definitive Guide to Annual Agricultural Output & Data Trends
Global food production totals billions of tonnes each year, and the underlying numbers shift constantly with weather, markets, and policy. Tracking those numbers is practical work. It supports food security planning, guides sustainable development, and feeds into decisions across government, industry, and research.
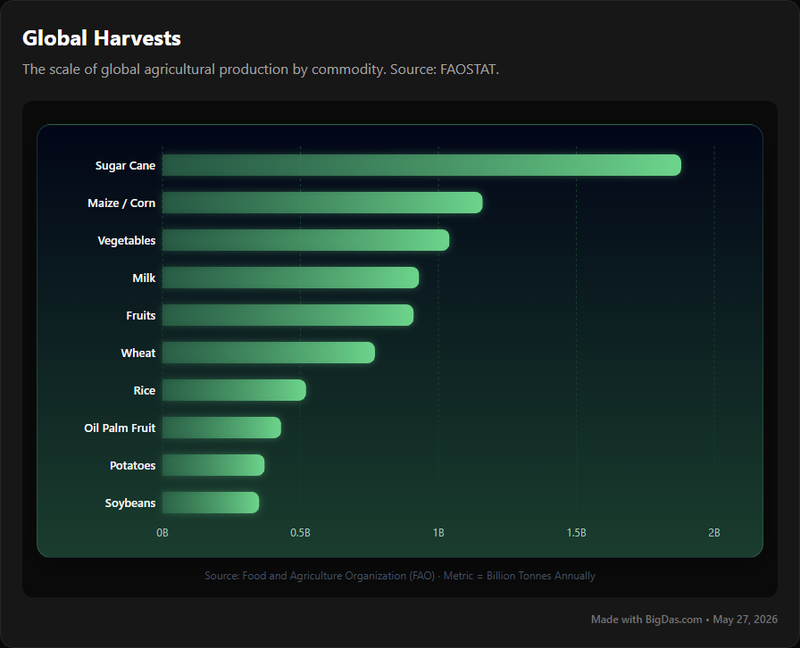
This guide covers "Global Food Production," a dataset that reports annual global food production by commodity in billion tonnes. It draws on FAO statistics and is aimed at researchers, policymakers, agricultural professionals, and anyone who needs a clear view of the world's food and agriculture production numbers.
What is Global Food Production?
"Global Food Production" is a dataset and insights resource that compiles annual output of major agricultural commodities worldwide, measured in billion tonnes. It groups grains, fruits, vegetables, livestock products, and other food categories into a single comparable framework.
The data comes from the Food and Agriculture Organization of the United Nations (FAO). The FAO is the standard reference for agricultural statistics and applies consistent collection and reporting methods across nearly every country. That consistency makes the dataset reliable for cross-region and cross-commodity comparison.
The tool lets users:
Identify which commodities dominate by mass.
Track year-on-year
productionchanges for specific items.Compare global output in billion-tonne terms.
See the scale behind feeding a growing population.
For anyone working with data-driven decisions in agriculture, "Global Food Production" is a baseline reference.
Key Features & Benefits
The "Global Food Production" tool builds on FAO data and includes the following features and benefits.
Key Features:
- Comprehensive Commodity Coverage
- Covers staple grains (wheat, rice, maize), roots and tubers, oilseeds, pulses, fruits, vegetables, sugar crops, meat, dairy, eggs, and fish/aquaculture. The full list follows
FAOclassifications.
- Annual Granularity
- Data is reported by year, which makes year-over-year comparison straightforward and lets users spot growth, stagnation, or decline for any commodity.
- Global Aggregation in Billion Tonnes
- All
productionis summed globally and expressed in billion tonnes. The unit is consistent across commodities, so comparisons stay valid even when intrinsic values differ.
- Authoritative Data Source (FAO Linkage)
- Numbers come from the
FAO, which sets international reporting standards. This gives the dataset high credibility foragriculturestatistics.
- Interactive Data Visualizations
- Includes bar charts, line charts, pie charts, and heat maps that turn the numbers into readable visual narratives. Interactive elements (hover, filters, sliders) let users explore the data directly.
- Historical Data Archiving
- Decades of historical
productiondata are available, which is necessary for identifying long-term trends and cyclical patterns.
- Search and Filtering Capabilities
- Search and filter by commodity, year, or category to navigate the dataset quickly.
- Data Export Functionality
- Selected data can be exported (CSV, Excel) or pulled through an API for custom analysis.
Key Benefits:
- Informed Decision-Making
- Policymakers, businesses, and organizations can base decisions on actual
food productionnumbers rather than estimates.
- Trend Identification & Forecasting
- Annual data plus historical archives support trend analysis and forecasting for commodity supply and demand.
- Enhanced Food Security Analysis
Productionvolumes reveal potential shortfalls and surpluses, which is the starting point for reserves, aid, and trade planning.
- Supply Chain Optimization
Foodsupply chain participants can use the data to plan sourcing, manage inventory, and respond to changes in globalproduction.
- Academic & Research Support
- Researchers get a centralized,
FAO-sourced dataset for studies on agricultural economics, climate adaptation, and sustainablefoodsystems.
- Public Awareness & Education
- The visualizations make
food productiondata accessible to the public, journalists, and educators.
- Benchmarking & Performance Evaluation
- Governments and organizations can compare domestic
productionandagriculturepolicy outcomes against global averages.
Step-by-Step Guide on How to Use It
Step 1: Accessing and Initial Orientation
- Locate the Platform
- Open the online platform or database that hosts the "Global Food Production" data. This may be an
FAOportal, an agricultural statistics site, or a dedicated dashboard.
- Understand the Interface
Take a minute to scan the layout. Look for:
A search bar or filter options.
Menu categories (e.g. "Commodity Data," "Annual Reports," "Trends").
Sections for "Latest Data" or "Featured Visualizations."
Data source notes confirming
FAOor another reputable origin.
Step 2: Selecting Your Data Parameters
- Choose Your Commodity
- Use the search bar or dropdown to select a commodity (e.g. wheat, maize, rice, potatoes, cattle meat, milk, freshwater fish, sugar cane, palm oil).
- Some platforms support multi-select for comparison.
- Specify the Timeframe
Pick the year or range you want. Most tools default to the latest year but allow:
A single year (e.g. 2022).
A range (e.g. 2000 to 2022) for trend analysis.
The tool focuses on global aggregation. Some advanced versions offer country-level breakdowns.
Step 3: Interpreting the Data and Visualizations
- Review the Raw Data Table
- The table typically shows commodity, year, and
productionin billion tonnes. Confirm units in the column headers.
- Engage with Visualizations
Line Graphs: Track a single commodity's
productiontrend over time. Look for slopes, peaks, and plateaus.Bar Charts: Compare
productionacross commodities for one year, or compare the same commodity across years.Pie Charts/Treemaps: Show a commodity's share of total global
food productionfor a given year.Interactive Elements: Hover for values, adjust time sliders, toggle legend items.
- Look for Anomalies and Patterns
Spikes or drops may correspond to weather events, policy changes, or economic shocks.
Identify sustained growth or decline.
Compare across commodities if you selected more than one.
Step 4: Deeper Analysis and Exporting
- Compare and Contrast
- Use filters to compare commodities side-by-side, or pair
productiondata with economic or climate data (on-platform or external).
- Export Data
Look for an "Export" or "Download" button.
Common formats:
.CSVand.XLSX.Check usage terms, especially for commercial applications.
- Share Insights
- Many platforms allow direct sharing of charts or tables via social media or email.
Why You Need This Tool (Use Cases)
1. For Policy Makers & Government Agencies:
Food Security Strategy: Assess global supply of staple
fooditems to inform nationalfoodsecurity policy, reserves, and trade planning.Agricultural Policy Formulation: Identify which commodities are growing or declining globally to shape subsidies, research funding, and land-use policy.
International Trade & Diplomacy: Use global
productiondata as context for trade negotiations, tariffs, and quota discussions.Climate Change Adaptation: Pair historical
productiontrends with climate data to plan for climate-resilientagriculture.
2. For Agricultural Economists & Researchers:
Market Analysis & Forecasting: Model supply-side dynamics, forecast
food productionscenarios, and study market volatility.Impact Assessment: Measure how technology, policy, disease, or weather affects global
food production.Sustainability Studies: Track resource intensity per tonne of
foodproduced and progress against sustainability goals.Academic Studies & Publications: Use a reliable
FAO-sourced dataset for theses, journal articles, and teaching.
3. For Food Industry & Supply Chain Professionals:
Sourcing & Procurement: Identify regions with stable or growing
productionfor sourcing and supplier diversification.Inventory & Risk Management: Anticipate supply gaps and adjust inventory, hedging, and logistics.
Investment Decisions: Evaluate market opportunities and the viability of agricultural ventures.
New Product Development: Spot shifts in
productionto guide ingredient and product strategy.
4. For NGOs & Development Agencies:
Humanitarian Aid & Development Planning: Use global
productionshortfalls to allocate aid and plan development projects.Advocacy & Awareness: Use the visualizations in campaigns on
foodsecurity and sustainableagriculture.
5. For Educators, Students & Journalists:
Educational Resource: Use the tool to teach global
foodsystems, agricultural economics, and environmental science.Data-Driven Storytelling: Report on
food productionissues andagriculturetrends with accessible visuals.
FAQ Section
Q1: What specific commodities are covered by the "Global Food Production" data?
A: Coverage includes major staples such as cereals (wheat, rice, maize, barley), roots and tubers (potatoes, cassava), oilseeds (soybeans, palm oil), pulses (beans, lentils), fruits, vegetables, sugar crops, livestock products (meat, dairy, eggs), and fish and aquaculture production. The full list follows FAO classifications.
Q2: How frequently is the "Global Food Production" data updated?
A: The dataset is annual. New figures are released once a year, typically several months after the close of the calendar or agricultural year to allow collection, validation, and aggregation from reporting countries.
Q3: What is the primary source of the data used in "Global Food Production"?
A: The Food and Agriculture Organization of the United Nations (FAO). The FAO collects and disseminates official statistics from its member countries under a standardized methodology.
Q4: Can I download the data for my own analysis or research?
A: Yes. The platform supports export to CSV and Excel (.xlsx) for custom analysis, modeling, or visualization.
Q5: Does the tool provide regional or country-level breakdowns of production?
A: The "Global Food Production" view is global, but the underlying FAO data includes regional and country-level figures. Linked FAOSTAT databases or advanced versions of the tool allow drill-down by country or region.
Q6: How is the "billion tonnes" measurement standardized across different commodities?
A: The tonne (1,000 kg) is a universal weight unit. Applying it uniformly across commodities makes the physical volume of food comparable regardless of density or value.
Q7: What methodologies does FAO use for data collection, and how reliable is it?
A: The FAO works with national statistical offices and ministries of agriculture, using surveys, census data, and administrative records. Data goes through cross-checking, reconciliation, and expert review, which is why FAO statistics are the standard reference for global agriculture.
Q8: Can this data be used to predict future food production?
A: "Global Food Production" provides historical and current production figures. Predicting future production requires models that also factor in climate, economics, technology, and geopolitics. The dataset is a foundation for that modeling.
Conclusion
"Global Food Production" consolidates FAO-backed food and agriculture production data into a single, comparable view measured in billion tonnes. It shows the trends, scale, and shifts behind global food supply.
The dataset supports policymakers, supply chain planners, researchers, and educators. The visualizations make the numbers readable, and the underlying data is exportable for deeper work.
Reliable, authoritative food production data is a basic input for sound decisions on food security, sustainability, and trade.