
Global Homicide Rates

Understanding Global Homicide Rates: A Data Analysis Tool for Safety & Crime Insights
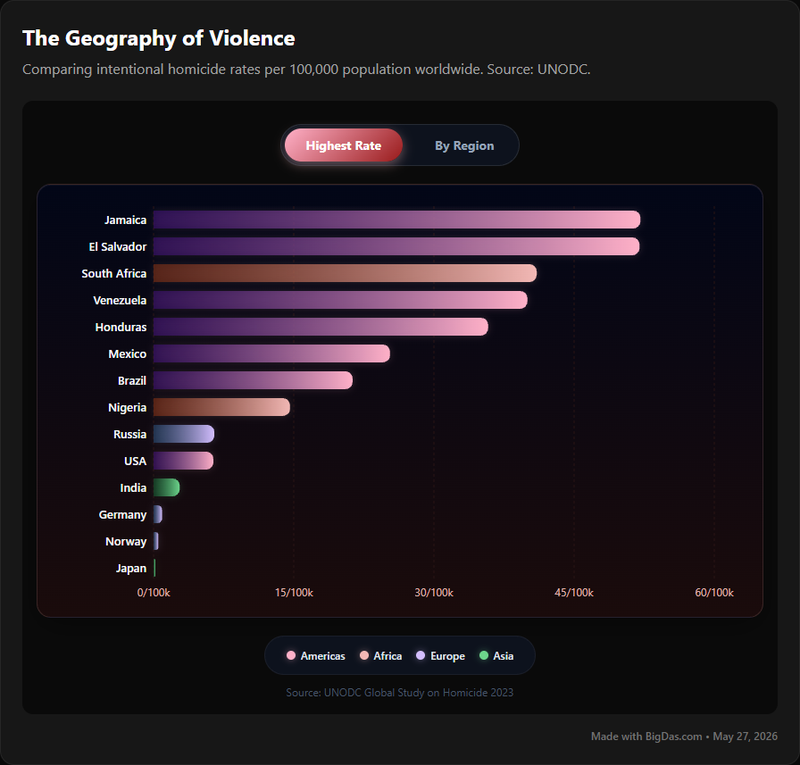
News headlines give fragments. Reliable insight into global crime, especially intentional homicide, requires standardized data and clear presentation. The Global Homicide Rates tool provides exactly that: a country-by-country view of the intentional homicide rate per 100,000 population.
The tool draws primarily from the UNODC (United Nations Office on Drugs and Crime), the leading international body for crime statistics. It converts national figures into a comparable, per-capita format, making it useful for researchers, policymakers, journalists, and anyone tracking global crime and safety trends.
What is the Global Homicide Rates Tool?
The Global Homicide Rates tool is an interactive platform that compiles and visualizes intentional homicide data by country. The primary metric is the intentional homicide rate per 100,000 population, which normalizes the data and allows fair comparison between countries of different sizes.
"Intentional homicide" follows international statistical standards: the unlawful death of one person inflicted purposefully by another. The definition excludes justified killings, accidents, and war-related deaths.
Data integrity is critical for a topic this sensitive. The tool sources its figures from the UNODC and similar vetted international bodies, which work with national statistical offices and law enforcement agencies to standardize methodology. This makes the tool a reliable source for crime and safety statistics.
Key Features & Benefits
The Global Homicide Rates tool is built to make complex data accessible and useful. Each feature supports a specific analytical task.
Key Features
- Interactive Global Map: A color-coded world map shades countries by
homiciderate. A legend indicates severity, giving an immediate visual read of regional patterns. - Country-Specific Profiles: Clicking a country (or selecting it from a search bar) opens a profile with historical data, trends, and contextual notes.
- Time-Series Visualization: Line and bar charts show
homiciderates across multiple years, making increases, decreases, and plateaus easy to identify. - Filtering and Sorting: Users can filter by year, region, or rate range. Data tables sort ascending or descending by rate, country, or year.
- Comparative Analysis: Multiple countries can be selected and viewed side-by-side on a single chart or table.
- Data Export: Charts export as PNG or JPEG. Raw data downloads as CSV or Excel for further analysis.
- Transparent Sourcing: The tool cites its sources, typically including the UNODC, and provides access to original reports.
- Definitions and Methodology: The platform explains how "intentional homicide" is defined and how data is collected and normalized.
Benefits
- Informed Decision-Making: Policymakers, NGOs, and international organizations use the data to shape
crimeprevention strategies and allocate resources. - Research and Academia: Standardized data supports comparative studies, trend analysis, and theoretical work in criminology and related fields.
- Journalism: Reporters can cite accurate, contextualized
homicidestatistics instead of relying on anecdotal figures. - Travel and Relocation Planning: Individuals can assess risk factors for destinations using credible data.
- Education: Students and teachers in criminology, sociology, international relations, and geography can use the tool as a teaching resource.
- Data Literacy: Visual presentation helps users build skills in reading and interpreting statistical data.
- Benchmarking: Governments and organizations can compare national
safetyperformance against regional and global averages. - Trend Detection: Historical and comparative views help identify emerging patterns in
homiciderates.
Step-by-Step Guide on How to Use Global Homicide Rates
The interface is designed to be intuitive, whether you're a researcher or a casual user. Interface details may vary, but the core workflow is consistent.
Step 1: Accessing the Platform
- Navigate to the Tool's Website:
- Open your browser and enter the URL for the Global Homicide Rates platform.
- Initial Overview:
- On load, you'll see an interactive world map color-coded by
homiciderate. A legend explains the color scale, typically showing rates per 100,000 population.
Step 2: Selecting and Exploring Countries
- Direct Map Interaction:
- Click any country on the map. A pop-up usually shows the current
homiciderate and basicsafetydata.
- Using the Search Bar:
- Locate the search bar (usually at the top or side). Type a country name (e.g., "Brazil," "Japan," "South Africa") and select from the suggestions.
- Accessing Country Profiles:
Clicking a country opens a profile page with:
The latest
homiciderate.Historical data in line or bar charts.
Contextual notes or footnotes.
A data source citation (often UNODC).
Step 3: Filtering and Refining Your Data View
- Year Selection:
- Use the year filter (dropdown or slider) to view
homiciderates for a specific year across all countries.
- Regional Filters:
- Apply region filters (e.g., "Africa," "Europe," "Americas," "Asia") to narrow the map and tables to a specific area.
- Rate Range Filters:
- Some platforms let you filter countries within a specific
homiciderate range (e.g., 5.0 to 15.0 per 100,000).
Step 4: Comparative Analysis
- Activate Comparison Mode:
- Click a "Compare" or "Add to Comparison" button to add countries to a list.
- View Side-by-Side Data:
- The tool generates a comparison view with
homiciderates shown on a single chart or in a comparative table.
- Analyze Trends Together:
- Comparative charts make it easy to spot divergent or convergent
crimetrends across countries over time.
Step 5: Understanding Data Visualizations
- Interpreting Maps:
- Darker shades indicate higher
homiciderates; lighter shades indicate lower rates.
- Reading Charts:
- Line Graphs: Show trends over time. The x-axis is years; the y-axis is the
homiciderate. - Bar Charts: Compare rates between countries or categories for a specific year.
- Tooltips: Hover over data points to see exact
homiciderates and years.
Step 6: Exporting and Downloading Data
- Locate Export Options:
- Look for "Export," "Download Data," or "Save Image" buttons on profile pages, comparison views, or data tables.
- Choose Your Format:
- Download charts as PNG or JPEG, or raw data as CSV or Excel for statistical analysis.
Step 7: Reviewing Sources and Definitions
- Check Data Sources:
- Refer to the "Data Sources" or "Methodology" section to confirm credibility (e.g., UNODC) and understand limitations.
- Understand Definitions:
- Read the tool's definition of "intentional homicide" to ensure consistent interpretation across regions.
Why You Need This Tool: Crucial Use Cases
The Global Homicide Rates tool serves a wide range of professionals and individuals by presenting complex homicide data in a usable format.
1. For Researchers and Academics
- Comparative Criminology: Cross-national comparisons of
homiciderates, correlated with socioeconomic and governance variables. - Trend Analysis: Historical time-series data reveal long-term trends, cycles, and anomalies in
homiciderates. - Policy Evaluation: Observe
homiciderate shifts following policy changes or societal events. - Doctoral and Post-Doctoral Work: Use the dataset for dissertations, theses, and papers on global
safety,crimeepidemiology, and international security. - Data Validation: Compare localized study findings against broader national and international trends.
2. For Policymakers and Governmental Agencies
- Evidence-Based Policy: Develop targeted
crimereduction strategies and allocate resources to high-risk areas. - International Cooperation: Identify countries that need support for
crimeprevention and justice reform. - Benchmarking: Compare national
homiciderates against regional and global averages. - Diplomacy and Travel Advisories: Inform foreign policy and travel guidance with reliable
safetydata.
3. For Journalists and Media Professionals
- Contextualizing News: Provide broader context for stories about specific events or regions.
- Investigative Journalism: Use the data as a starting point for investigations into why certain regions have unusually high or low
homiciderates. - Infographics and Visual Storytelling: Build compelling visualizations that explain complex
crimestatistics. - Fact-Checking: Verify claims and statistics about
homicideandsafetymade by public figures or other outlets.
4. For NGOs and Humanitarian Organizations
- Advocacy and Awareness: Use
homicidedata to highlight areas of concern and press for action. - Program Planning: Prioritize intervention programs, such as community violence reduction or victim support, in high-rate regions.
- Funding Proposals: Strengthen proposals with credible data from sources like the UNODC.
5. For Travelers, Expats, and Global Citizens
- Travel Planning: Assess the general
safetylandscape of destinations. - Relocation Decisions: Get a data-driven view of the
crimeenvironment in potential new countries. - Global Awareness: Build a more nuanced understanding of
crimeandsafetyworldwide.
Frequently Asked Questions (FAQ) about Global Homicide Rates
Q1: What does "intentional homicide" mean in this context?
A: "Intentional homicide" is the unlawful death of one person purposefully inflicted by another, as defined by international statistical standards (including those of the UNODC). The definition excludes deaths from armed conflict, legal intervention, justifiable killings, and accidents. The focus is on purposeful interpersonal violence.
Q2: Where does the data for this tool come from?
A: The data comes primarily from international bodies that collect and standardize crime statistics from national authorities. The UNODC is the leading source. Other contributors include national statistical offices, INTERPOL, and regional organizations. All data is harmonized for comparability.
Q3: How often is the data updated?
A: Update frequency varies. National homicide statistics are typically released annually, then compiled and published by the UNODC and similar bodies. The tool is usually updated at least once a year. Check the "Last Updated" section on the platform for specifics.
Q4: Are all countries included in the dataset?
A: The tool aims for global coverage, but data gaps exist. Some countries do not consistently report homicide statistics to international bodies, or their data does not meet inclusion standards. Most recognized countries are included, though certain territories or years may be missing. The tool flags missing data points.
Q5: What are the limitations of international homicide data?
A: Key limitations include:
- Reporting Differences: National methodologies vary. Some countries underreport, overreport, or categorize
homicidedifferently. - Data Timeliness: There's a lag between when
homicidesoccur, when they're recorded, and when they reach international databases. - Conflict Zones: Data from active conflict regions is often unreliable or incomplete.
- Definition Nuances: Slight variations in national legal definitions of
homicidecan affect comparisons. - Undercounting: Some
homicidesgo undetected, especially where judicial systems are weak.
Despite these limitations, UNODC data remains the most authoritative source for global crime and safety comparisons.
Q6: Can I download the raw data for my own analysis?
A: Yes. Look for "Export" or "Download Data" buttons, which typically provide data in CSV or Excel format. This is useful for researchers and journalists conducting in-depth analysis.
Q7: How does this tool contribute to understanding global safety?
A: By standardizing and visualizing homicide rates, the tool provides a basis for assessing global safety landscapes. Homicide is a reliable indicator of overall societal stability. The data helps identify areas of concern, monitor crime prevention efforts, inform travel decisions, and support data-driven discussions about human security.
Conclusion: Data as a Foundation for Understanding Global Safety
The Global Homicide Rates tool converts sensitive, complex data into clear, comparable insights. By presenting the intentional homicide rate per 100,000 population by country, it gives researchers, policymakers, journalists, and global citizens a foundation for understanding the state of crime and safety worldwide.
The platform's reliance on UNODC data ensures credibility. Its interactive maps, country profiles, and comparison tools make the data accessible and usable for policy work, academic research, ethical reporting, and personal safety decisions.
Ultimately, Global Homicide Rates is a practical resource for anyone working to understand and address the realities of violent crime and global safety.