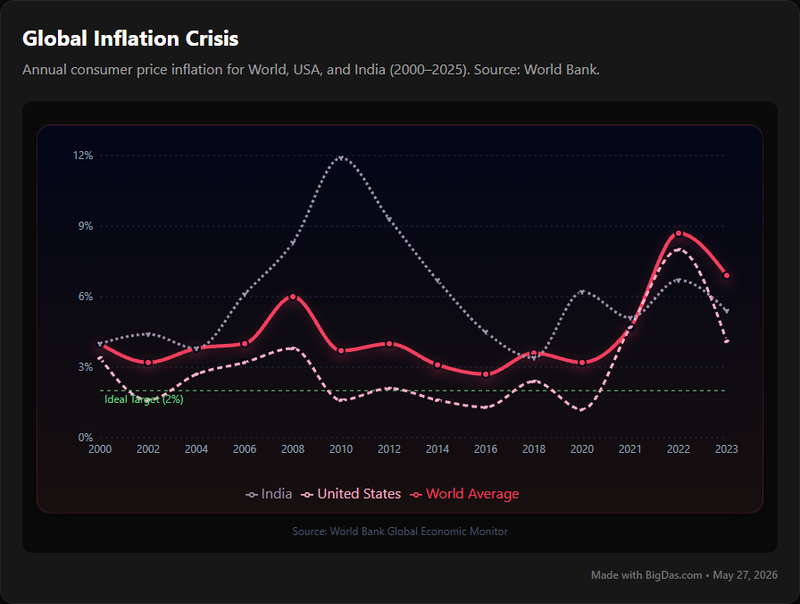
Global Inflation Rates

Navigating the Economic Tides: Understanding Global Inflation Trends with a Powerful Data Resource
In a world perpetually shaped by economic shifts, few metrics hold as much sway over our financial well-being and strategic decisions as inflation. It’s the silent force that dictates the purchasing power of our currency, influences investment returns, and drives the cost of living. For anyone—from the individual planning their household budget to the multinational corporation strategizing market entry, or the academic researching economic phenomena—a clear, concise understanding of inflation trends is not merely beneficial; it is essential.
Yet, grappling with inflation data can often feel like navigating a complex labyrinth. Disparate sources, varying methodologies, and an overwhelming volume of information can obscure the critical insights needed to make informed choices. This challenge is precisely what the "Global Inflation Rates" tool addresses. It stands as a beacon of clarity, offering a curated, easily digestible, and profoundly insightful look into consumer price index (CPI) movements across key economies and the global aggregate over two decades.
This post will delve into how this invaluable resource can demystify the intricacies of prices shifts, empower better decision-making, and help users truly appreciate that well-presented data is beautiful, transforming raw numbers into actionable understanding. We’ll explore its features, guide you through its utility, and illustrate why, for anyone keen to grasp the pulse of the economy, this tool is an indispensable ally.

What is Global Inflation Rates?
At its core, the "Global Inflation Rates" tool is a meticulously compiled digital resource designed to provide a panoramic and granular view of annual consumer price inflation. It isn't just a collection of numbers; it's a historical narrative, meticulously charted to reveal the ebb and flow of prices and their impact on daily life and broader economic stability.
Specifically, this tool delivers annual consumer price inflation data, measured through the Consumer Price Index (CPI), for three pivotal economic entities:
- The World: Providing an overarching perspective on global inflationary pressures and trends, reflecting the collective economic health and interconnectedness of nations.
- The USA: Offering specific insights into one of the world's largest and most influential economies, crucial for understanding Western market dynamics and policy impacts.
- India: Presenting data for a rapidly growing and significant emerging economy, vital for comprehending developing market challenges and opportunities.
The dataset spans a significant and impactful period: from 2000 to 2023. This comprehensive timeframe encompasses a multitude of economic cycles, including periods of significant global growth, major financial crises, technological revolutions, and unprecedented events like the global pandemic. By providing this consistent, long-term view, the tool allows users to move beyond snapshots and truly understand the trajectory and momentum of inflationary forces.
In essence, "Global Inflation Rates" distills complex economic realities into an accessible format, making the critical insights of CPI data available to a broad audience, fostering deeper understanding of how prices evolve and what that means for the economy at large.
Key Features & Benefits: Unlocking Economic Clarity
The true power of the "Global Inflation Rates" tool lies in its carefully designed features, each crafted to deliver specific benefits that enhance understanding and empower better decision-making. Far from being a mere repository of numbers, it's structured to turn complex economic data into clear, actionable intelligence.
1. Comprehensive Historical Data (2000-2023)
Feature: The tool provides a robust dataset covering 24 years of annual consumer price inflation. This extensive timeline is consistent across all regions – World, USA, and India. Benefit: This long-term perspective is invaluable for trend analysis and contextual understanding. Instead of relying on short-term fluctuations, users can identify sustained patterns, cyclical behaviors, and the long-term impact of past economic policies or global events. Understanding how inflation behaved during the Dot-com bubble, the 2008 financial crisis, or the COVID-19 pandemic provides crucial context for interpreting current economic conditions and anticipating future challenges. For example, observing how prices reacted to specific shocks over two decades helps in calibrating expectations for future market volatility.
2. Multi-Regional Comparative Analysis (World, USA, India)
Feature: Data is simultaneously presented for the global aggregate, the United States, and India. This tripartite view offers a unique comparative lens. Benefit: This feature is instrumental for understanding interconnectedness and divergence in the global economy. Users can easily compare the pace of inflation in a developed market like the USA with an emerging giant like India, and benchmark both against the global average. This helps in discerning whether inflationary pressures are localized, regional, or systemic. For investors, it can inform diversification strategies; for businesses, it highlights regional cost disparities; and for policymakers, it illuminates the global context of national economic challenges. The clarity derived from juxtaposing these diverse economies makes it evident that data is beautiful when it facilitates such profound comparisons.
3. Focus on Consumer Price Index (CPI)
Feature: The tool exclusively uses the Consumer Price Index (CPI) as its primary metric for measuring inflation. Benefit: By standardizing on CPI, the tool offers a universally recognized and reliable measure of the cost of living. CPI tracks changes in the prices of a basket of consumer goods and services, directly reflecting the impact of inflation on households and their purchasing power. This consistency eliminates ambiguity and allows for direct, apples-to-apples comparisons across years and regions. For anyone concerned with real wages, pension values, or the affordability of goods, the CPI data provides the most direct and relevant insights into how inflation erodes or sustains economic welfare.
4. Intuitive and Accessible Data Presentation
Feature: While the description implies raw data, the keyword "data is beautiful" suggests a presentation designed for clarity and ease of comprehension, likely involving visual elements like charts or graphs alongside tabular data. Benefit: An accessible presentation transforms complex numbers into understandable insights. Rather than sifting through endless spreadsheets, users can quickly identify trends, peaks, and troughs in inflationary rates. This visual clarity significantly reduces the learning curve and allows for rapid insight generation. Whether you're a seasoned economist or a curious individual, the ability to grasp the essence of inflationary movements at a glance is a powerful advantage, reinforcing the idea that well-structured data is beautiful in its ability to communicate complex truths simply.
5. Reliability and Authoritative Source (Implied)
Feature: A dedicated tool providing specific economic metrics for defined regions and timeframes suggests a commitment to accuracy and authoritative sourcing. Benefit: Trustworthiness is paramount when dealing with economic data. Users can rely on the "Global Inflation Rates" tool to provide consistently sourced and validated inflation figures. This assurance allows individuals, businesses, and researchers to make critical decisions with confidence, knowing their foundational data is robust and dependable. The authority of the data underpins its utility for everything from academic research to informing public policy discussions about the future of the economy.
Together, these features transform raw inflation numbers into a compelling narrative of economic change, providing the clarity and context needed to understand our financial world better.
Step-by-Step Guide: How to Use the Global Inflation Rates Tool
The "Global Inflation Rates" tool is designed for clarity and ease of use, making complex economic data accessible to everyone. While specific interface details might vary, the core process of leveraging its insights remains intuitive. Here's a conceptual step-by-step guide to maximize your engagement with this valuable resource.
Step 1: Accessing the Tool
Typically, you would navigate to the platform or website where the "Global Inflation Rates" tool is hosted. Look for a clear link or section dedicated to economic data or inflation trends. The interface is likely streamlined to present the core data without unnecessary complexity.
Step 2: Understanding the Data Presentation
Upon accessing the tool, you'll likely encounter a primary display showing the annual consumer price inflation rates. Given the "data is beautiful" emphasis, expect an intuitive visualization, possibly in the form of line graphs or bar charts, accompanied by clear tabular data.
- Regional Grouping: The data will be distinctly organized by region: World, USA, and India. These might be presented as separate graphs, or overlaid on a single graph with different color codes, allowing for immediate visual comparison.
- Timeframe: The x-axis (or corresponding column) will consistently represent the years from 2000 to 2023. The y-axis (or values) will display the annual inflation percentage for each respective region.
Step 3: Interpreting the Visuals and Trends
This is where the power of the tool truly comes to life. Focus on the visual trends first.
- Identify Peaks and Troughs: Look for periods where inflation rates were exceptionally high or remarkably low for each region. What events might have coincided with these points (e.g., economic crises, specific policy changes, global supply chain disruptions)?
- Compare Regional Dynamics: How do the inflation trends for the USA and India compare to each other and to the global average? Are they moving in tandem, or are there significant divergences? For instance, does one economy experience higher volatility in prices than another?
- Observe Long-Term Patterns: Is there an overall upward, downward, or stable trend over the two-decade period for any particular region? Has the global economy shown a consistent direction in inflation, or has it been more volatile? This helps in understanding the prevailing economy conditions.
- Spot Outliers: Are there any years where inflation rates deviate significantly from the surrounding years without an obvious short-term recovery? Such anomalies often point to unique economic events.
Step 4: Delving into Specific Data Points
While visuals provide an overview, the tabular data (if available) allows for precise analysis.
- Hover/Click for Details: If using an interactive chart, hovering over a data point typically reveals the exact inflation rate for a specific year and region.
- Extract Specific Numbers: Locate the exact annual CPI percentage for any given year (e.g., USA inflation in 2008, India's inflation in 2020, or the World average in 2022). These specific numbers are crucial for detailed research or reporting.
Step 5: Drawing Initial Conclusions and Formulating Questions
Based on your observations, start forming insights.
- "The USA experienced a significant surge in inflation during [Year X], while India's prices remained relatively stable."
- "Global inflation appears to have generally followed an upward trajectory since [Year Y], with certain periods of rapid acceleration."
- "How did central bank policies in [Country] respond to the observed CPI spikes?"
This initial analysis can then lead to deeper research or inform your personal and professional financial decisions. The tool effectively serves as a starting point for more profound economic exploration, illustrating how well-organized data is beautiful for its analytical utility.
By following these steps, you can harness the "Global Inflation Rates" tool to gain a clear, informed perspective on inflation dynamics across the world's leading economies.
Why You Need This Tool: Unpacking Use Cases Across Sectors
Understanding inflation isn't just an academic exercise; it has tangible impacts on virtually every aspect of our lives and every sector of the economy. The "Global Inflation Rates" tool offers specific, actionable insights that cater to a diverse range of users, transforming complex CPI data into a powerful asset.
For Individuals and Households: Mastering Personal Finance
- Budgeting and Financial Planning: Knowing the historical inflation trends for regions like the USA and India allows individuals to project future costs more accurately. If prices are consistently rising by a certain percentage, budgeting needs to reflect this erosion of purchasing power. It helps in setting realistic savings goals and understanding the real value of their money over time.
- Retirement Planning: Inflation is a silent wealth killer. By examining long-term inflation data (2000-2023), individuals can better estimate how much they will need in the future to maintain their desired lifestyle, influencing their investment strategies and retirement savings targets.
- Investment Decisions: Understanding inflationary environments helps individuals choose investments that are more likely to preserve or grow their capital in real terms. High inflation periods might favor real assets over fixed-income securities.
- Negotiating Wages: Being aware of current and historical inflation rates provides a strong basis for employees to understand the need for wage adjustments to maintain their real income.
For Businesses and Corporations: Strategic Foresight
- Pricing Strategies: Companies can use historical inflation data for the World, USA, and India to inform their pricing models. If input costs are rising due to inflation, product prices may need to be adjusted to maintain profit margins.
- Supply Chain Management: Understanding regional inflation trends can help businesses anticipate rising costs for raw materials, manufacturing, and logistics in different parts of the world, particularly in key sourcing regions like India or major consumer markets like the USA.
- Market Entry and Expansion: For businesses considering expansion into new markets (e.g., India), analyzing its historical inflation provides crucial insights into cost structures, consumer purchasing power, and potential economic stability.
- Investment and Capital Expenditure: Executives assessing capital projects or expansion plans will consider the real cost of investment, factoring in how inflation will impact returns over the project's lifespan.
For Investors and Financial Analysts: Informed Portfolio Management
- Asset Allocation: Inflation is a key factor in asset allocation. By analyzing the long-term CPI data, investors can adjust their portfolios to include assets that historically perform well in different inflationary regimes, such as commodities or inflation-indexed bonds.
- Risk Management: Uncontrolled inflation can erode investment returns. The tool helps analysts assess inflation risk in different geographical markets, influencing decisions on international investments in the USA, India, or global funds.
- Economic Forecasting: Analysts can use historical inflation patterns (2000-2023) as a baseline to build more accurate economic models and forecasts for future CPI movements, essential for predicting interest rate changes and market sentiment.
- Currency Valuation: Inflation differentials between countries heavily influence exchange rates. Comparing USA and India inflation rates, for example, helps analysts understand potential shifts in currency valuations, impacting international investments.
For Academics and Researchers: Illuminating Economic Studies
- Empirical Research: The consistent, historical inflation data for the World, USA, and India from 2000-2023 provides a robust dataset for empirical studies on monetary policy effectiveness, the drivers of inflation, and its socio-economic impacts.
- Policy Analysis: Researchers can analyze the correlation between specific economic policies (e.g., fiscal stimulus, interest rate changes) implemented in the USA or India and subsequent inflationary outcomes, offering insights for future policy recommendations.
- Global Economic Trends: The tool facilitates research into global inflation convergence or divergence, helping to understand the transmission mechanisms of inflation across borders and the health of the interconnected global economy.
For Policymakers and Economists: Guiding Fiscal and Monetary Decisions
- Monetary Policy Formulation: Central banks closely monitor CPI to set interest rates and manage the money supply. Historical data provides crucial context for evaluating the effectiveness of past policies and formulating future strategies to achieve inflation targets.
- Fiscal Planning: Governments use inflation data to plan budgets, assess the real cost of public services, and index benefits or pensions. Understanding global inflation trends also helps in trade policy and international economic negotiations.
- Public Understanding: Easily digestible inflation data aids in communicating complex economic realities to the public, fostering transparency and informed public discourse about the economy.
In every scenario, the "Global Inflation Rates" tool proves that well-organized and clearly presented data is beautiful because it equips users with the understanding needed to navigate the ever-changing landscape of prices and the broader economy.
FAQ Section: Clarifying Key Concepts
To further enhance your understanding and utilization of the "Global Inflation Rates" tool, here are answers to some frequently asked questions regarding inflation and the data presented.
Q1: What is the Consumer Price Index (CPI) and why is it important for measuring inflation?
The Consumer Price Index (CPI) is a measure of the average change over time in the prices paid by urban consumers for a market basket of consumer goods and services. This "market basket" includes everything from food and housing to transportation, medical care, and education. It's important because it directly reflects changes in the cost of living for households. When the CPI rises, it signifies that consumers need to spend more money to purchase the same goods and services, indicating an increase in inflation and a decrease in purchasing power. Therefore, CPI is the most widely recognized and crucial indicator for assessing inflation's impact on everyday citizens and the broader economy.
Q2: Why are these specific regions (World, USA, and India) included in the tool?
The selection of the World, USA, and India provides a comprehensive and strategically significant view of global inflation dynamics.
- World: Represents the aggregate global inflation trend, offering a macro-level perspective on worldwide economic forces and interconnectedness. It serves as a benchmark for understanding whether inflationary pressures are localized or global.
- USA: As the largest economy by nominal GDP and a major global consumer market, the USA's inflation trends have significant implications for international trade, financial markets, and global economic stability. Its economic policies often set precedents that impact other nations.
- India: Represents a major emerging economy with a rapidly growing population and increasing global influence. Its inflation dynamics offer insights into the challenges and growth patterns of developing markets, which are distinct from mature economies. This combination allows for meaningful comparative analysis between established, emerging, and global economic contexts.
Q3: How often is the data in the "Global Inflation Rates" tool updated?
The "Global Inflation Rates" tool provides annual consumer price inflation data from 2000 to 2023. This means the data points reflect the year-over-year percentage change for each full calendar year. Given its historical focus, it's designed to offer a consistent long-term perspective. While it covers up to the most recently completed year (2023), updates for future years would typically occur once the full annual data becomes available and is compiled. This annual frequency ensures robust, finalized data for historical analysis, though real-time monthly CPI updates are typically found in other, more frequently updated financial news sources.
Q4: Can I compare inflation rates between the different regions directly using this tool?
Absolutely. One of the primary benefits of the "Global Inflation Rates" tool is its ability to facilitate direct comparative analysis. By presenting inflation data for the World, USA, and India within the same timeframe (2000-2023) and using the same metric (CPI), users can easily see how inflationary pressures have differed or converged across these distinct economic landscapes. This allows for quick identification of periods where one region experienced significantly higher or lower inflation than another, or how national trends aligned with or diverged from the global average. This side-by-side comparison is where the true value of well-structured data is beautiful for economic analysis.
Q5: How does understanding historical inflation help me make better financial decisions?
Understanding historical inflation trends equips you with crucial foresight. By analyzing the 2000-2023 data, you can:
- Anticipate Future Costs: Project how much more expensive goods and services might become.
- Assess Investment Returns: Understand the "real" return on investments after accounting for inflation.
- Plan for Retirement: Estimate future living expenses more accurately for long-term financial goals.
- Evaluate Savings: Recognize how inflation erodes the purchasing power of cash savings over time.
- Inform Salary Expectations: Understand the need for wage increases to maintain your standard of living. In essence, historical CPI data empowers you to make proactive rather than reactive financial decisions, safeguarding your wealth against the often-invisible force of rising prices in the economy.
Conclusion: Empowering Understanding in an Evolving Economy
In an economic landscape that is constantly in flux, the ability to clearly understand the forces shaping our financial realities is paramount. The "Global Inflation Rates" tool serves as an indispensable resource, cutting through the noise to deliver focused, reliable, and deeply insightful consumer price index data for the World, USA, and India, spanning a critical period from 2000 to 2023.
This tool is more than just a collection of numbers; it's a window into the past two decades of economic change. By presenting historical inflation trends with clarity and precision, it empowers a diverse range of users – from individuals managing their household budgets to global investors making strategic decisions, and from academics pursuing critical research to policymakers crafting national strategies. It underscores the profound truth that when well-organized and thoughtfully presented, data is beautiful in its capacity to illuminate complex economic realities.
By providing a clear, comparative view of prices across significant global economies, the "Global Inflation Rates" tool equips you with the context and insights needed to navigate the economy with greater confidence and informed understanding. It offers a solid foundation for comprehending the real-world impact of inflation, fostering smarter decisions, and ultimately, a more informed engagement with the economic world around us.