
Internet Users Growth

Mapping the Digital Frontier: Understanding Global Internet Adoption and Growth from 2000-2023
The internet has reshaped communication, commerce, education, and social interaction. From a niche technology at the turn of the millennium to a utility used by billions today, its spread has been rapid. Tracking the patterns of digital adoption across nations is useful for businesses, policymakers, researchers, and anyone who wants to understand how connectivity has expanded.
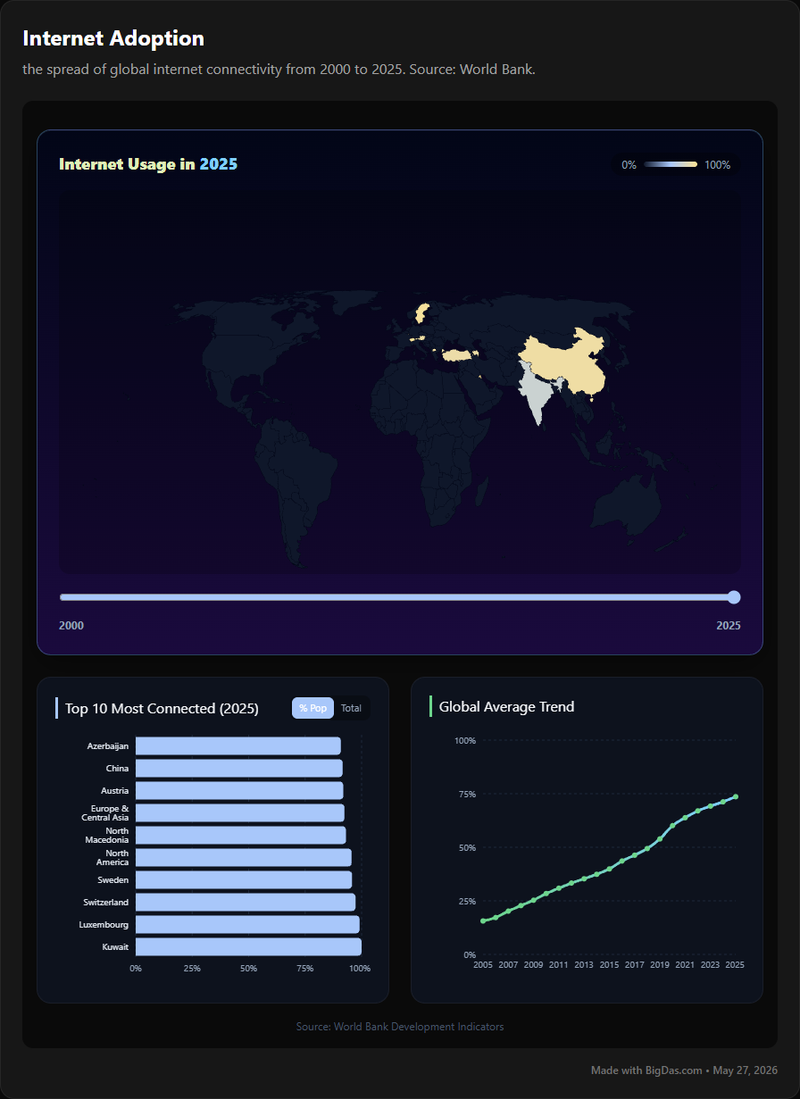
The Internet Users Growth tool provides a country-by-country breakdown of the share of population using the internet from 2000 to 2023, turning raw statistics into clear insights.
This page covers the tool's features, how to use it, and common questions.
What is Internet Users Growth?
The Internet Users Growth tool tracks and presents global internet penetration. It provides historical data on the share of population using the internet for every country from 2000 to 2023.
It answers a basic question: What percentage of a country's population used the internet at any point between 2000 and 2023?
The tool measures penetration as a percentage, which standardizes comparisons between countries of different sizes and economic structures. Using the share of population, rather than absolute user counts, gives a clearer picture of how deeply the internet is integrated into each society.
The 2000-2023 period covers the early stages of public internet access, the broadband and mobile expansion phase, and the more recent shifts driven by increased digital literacy, pandemic-era adoption, and changing regulations. This range is useful for understanding current penetration levels and the path that led to them.
Key Features & Benefits
Key Features
- Historical data (2000-2023): Covers over two decades of internet adoption. Useful for long-term trend analysis and identifying inflection points or plateaus in growth.
- Country-level granularity: View individual country data to understand localized penetration rates.
- Comparative analysis: Compare adoption rates across countries or continents. Identify leaders, spot regional disparities, and benchmark against global averages.
- Interactive visualizations: Charts, graphs, and maps present data in an accessible format. Trends are visible at a glance.
- Trend identification: Observe year-on-year changes, periods of rapid acceleration, and potential saturation points.
- Exportable data: Download raw data for custom analysis or export charts for reports and presentations.
- User-friendly interface: Navigate, filter, and customize views without specialized training.
Benefits
- Strategic planning: Businesses can use adoption data to inform market entry, product localization, and digital marketing. Governments can guide infrastructure investment and digital literacy programs.
- Market research: Identify underserved markets, assess the potential for digital products, and understand consumer readiness for online engagement in specific regions.
- Research: Provides empirical data for studies on the digital divide, economic development, and the social impact of technology.
- Policy development: Governments and NGOs can target policies for bridging the connectivity gap and promoting digital inclusion.
- Competitive intelligence: Benchmark target markets or identify emerging digital landscapes.
- Data communication: Visually engaging output makes it easier to share findings with stakeholders.
- Time savings: Centralizes data that would otherwise require manual collection from multiple sources.
Step-by-Step Guide on How to Use It
Step 1: Accessing the Tool
- Open your web browser and navigate to the Internet Users Growth tool.
- If the tool requires an account, log in or register. Many data tools offer a free tier or trial period.
Step 2: Initial Exploration & Overview
- On entry, you'll typically see a global overview, such as a world map color-coded by 2023 adoption rates or a global average trend line from 2000-2023. Familiarize yourself with the layout.
- Check any legends or keys that explain colors, line types, and symbols.
Step 3: Selecting Your Parameters
- Country selection:
- Single country: Use a search bar or dropdown to find a specific country.
- Multiple countries: Use an "Add Country" option or multi-select dropdown for comparisons.
- Regional selection: Some versions allow you to select entire regions (e.g., "Sub-Saharan Africa," "European Union") for aggregate data.
- Timeframe adjustment (2000-2023):
- The tool typically defaults to the full 2000-2023 range. Sliders, input boxes, or dropdowns labeled "Start Year" and "End Year" let you narrow the range if needed.
- Ensure your selected timeframe falls within the available data range.
Step 4: Viewing and Interpreting Data
- Chart generation: After selecting parameters, the tool generates visualizations. Common types include:
- Line graphs: Show adoption trends over time for one or more countries.
- Bar charts: Compare penetration rates between countries for a specific year.
- Heat maps (world map): Display adoption rates geographically, with color intensity indicating penetration.
- Hover for details: Most interactive charts display precise values when you hover over data points (e.g., "France, 2015: 84.5%").
- Identify trends:
- Look for upward slopes (growth), downward slopes (decline), and plateaus (saturation).
- Note the pace of change: exponential, linear, or slowing.
- Compare trajectories between countries. Which ones started low and caught up?
Step 5: Advanced Analysis and Export
- Filtering and sorting: Some tools let you filter by income level, region, or population size. You can also sort data tables by highest or lowest penetration.
- Downloading data: Look for "Download Data," "Export CSV," or "Export Excel" buttons to get the raw numbers.
- Exporting visualizations: Use "Download Chart" or "Export Image (PNG/JPEG)" options to save graphs for reports or presentations.
- Saving your view: Some tools allow you to save or bookmark custom views for later.
Why You Need This Tool (Use Cases)
1. Business & Market Expansion
- Market entry strategy: A company launching a digital product can assess a target market's internet penetration. High adoption signals a receptive environment; low adoption may require a different approach.
- Product localization: Developers can tailor software, apps, or content based on local adoption levels. High-penetration regions may prefer feature-rich online platforms; emerging regions may need simpler or mobile-first solutions.
- Digital marketing: Marketers can allocate budgets by identifying where target audiences are most likely to be online.
- E-commerce potential: Internet penetration correlates with the addressable market for online retail. Businesses can identify fast-growing e-commerce markets.
2. Researchers & Academics
- Socio-economic studies: Analyze the correlation between internet adoption and economic growth, education, political participation, or social mobility.
- Digital divide research: Compare developed and developing nations and assess initiatives aimed at closing connectivity gaps.
- Comparative policy analysis: Examine how different national policies (telecommunications regulations, digital literacy programs) have affected growth rates.
- Technology trend analysis: Use empirical data to study how quickly societies adopt new digital tools.
3. Government & NGOs
- Infrastructure planning: Identify areas with low penetration to guide broadband, satellite, or mobile network investment.
- Digital literacy programs: Target resources to populations with low adoption rates.
- Policy formulation: Develop evidence-based strategies for digital economic growth and e-government services.
- International development: Track progress toward Sustainable Development Goals related to technology access and allocate aid strategically.
4. Consultants & Analysts
- Client reporting: Provide data-backed recommendations for market entry, competitive strategy, or digital transformation.
- Trend spotting: Identify emerging digital hubs and forecast future growth trajectories.
- Investment decisions: Assess growth potential and digital readiness when evaluating technology sectors or emerging markets.
FAQ Section
Q1: What are the primary data sources for the tool?
A: Data is compiled from international organizations (ITU, World Bank, United Nations), national statistical offices, telecommunications regulatory bodies, and validated research institutions.
Q2: How frequently is the data updated?
A: Data is updated annually, typically after the release of comprehensive global reports and national statistics for the preceding year.
Q3: Can I compare multiple countries or regions simultaneously?
A: Yes. You can select multiple countries to view trends side-by-side. Direct regional aggregates (e.g., "European Union" as a single data point) may not always be available, but you can select all countries within a region to analyze their collective or individual performance.
Q4: What types of visualizations are available, and can I customize them?
A: The tool offers interactive line graphs for trend analysis, bar charts for single-year comparisons, and heat maps for geographic context. Customization of chart types may be limited, but you can typically adjust selected countries, timeframes, and data series.
Q5: Can I download the raw data?
A: Yes. You can export the underlying numerical data for your selected parameters as CSV or Excel files.
Q6: How is "share of population using the internet" defined?
A: This metric refers to the percentage of a country's total population that has accessed the internet from any location and any device (including mobile phones) within a specified recent period (usually the last 3 or 12 months). This definition aligns with international standards.
Q7: Can I find data for sub-national regions or cities?
A: Currently, the tool focuses on country-level data for consistent global comparison. Sub-national data varies in availability and methodology across countries.
Q8: How accurate is the historical data, especially for earlier years?
A: The tool relies on official and validated sources. Methodologies and reporting standards have evolved over the years, but figures represent the most reliable data available for each period. Any known estimations are noted in source documentation.
Q9: Does the tool account for mobile-only internet access?
A: Yes. The "share of population using the internet" metric includes all forms of internet access, both fixed broadband and mobile. As mobile technology expanded, particularly in developing nations, its contribution to overall adoption is reflected in the data.
Conclusion
The internet's evolution from 2000 to 2023 is one of the most significant technological and social shifts in recent history. Understanding digital adoption patterns across countries helps inform decisions about markets, policy, and research.
The Internet Users Growth tool provides country-specific data on internet penetration over more than two decades, along with visualizations that make trends easier to identify. Whether you're a business leader evaluating new markets, a researcher studying socio-economic impacts, a policymaker designing digital inclusion strategies, or simply trying to understand global connectivity trends, the tool offers a centralized source of historical data.