
Life Expectancy by Country

Unveiling Global Longevity: Explore Life Expectancy by Country Data for Deeper Health Insights
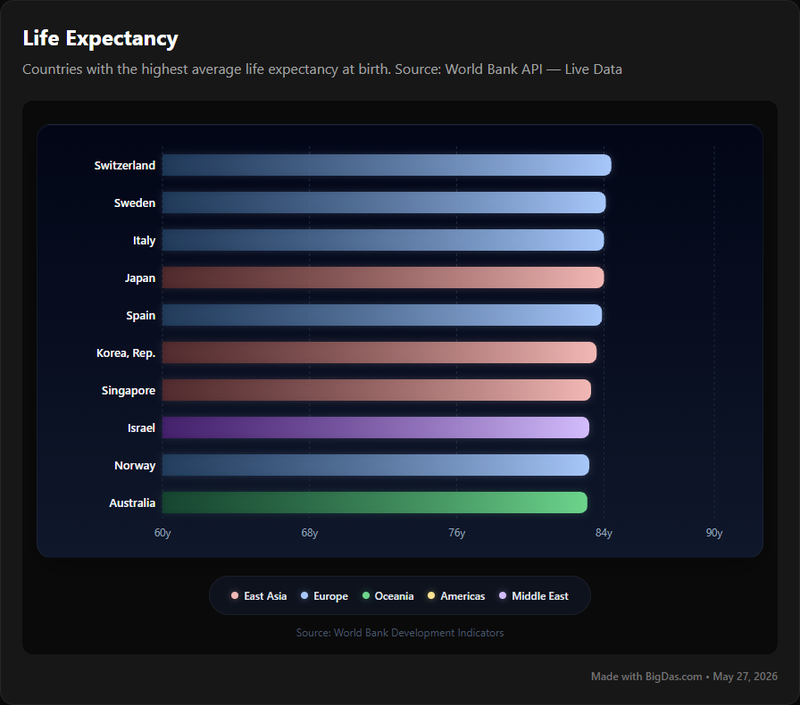
Understanding global health and well-being requires reliable demographic data. The Life Expectancy by Country tool collects and visualizes average life expectancy at birth for nations worldwide, turning complex statistics into an accessible format. The guide below covers what life expectancy means, the tool's features, how to use it, common applications, and answers to common questions.
What is Life Expectancy by Country?
Life expectancy is the average number of years a person is expected to live from birth, calculated using current mortality rates. "Life expectancy by country" refers to this metric broken down by nation. It serves as a core indicator of population health and socio-economic development.
The Life Expectancy by Country tool aggregates this data from selected countries and presents it through an interactive interface. Users can:
- Visualize global trends: Identify which countries report the highest longevity and which face the steepest health challenges.
- Compare nations: Contrast life expectancy between countries or regions.
- Explore influencing factors: Use the data as a starting point to investigate determinants like healthcare access, nutrition, sanitation, economic stability, and education.
- Track progress over time: Review historical figures to see how longevity has changed across decades.
The tool converts raw statistics into clear visuals, showing how health outcomes vary across cultures and economic conditions.
Key Features & Benefits of the Life Expectancy by Country Tool
Key Features
Interactive Global Map Visualization
- Feature: A color-coded world map shades countries by their average life expectancy. Hovering over a country reveals its specific value.
- Benefit: Gives an immediate visual overview of global longevity disparities and geographic patterns.
Detailed Country Profiles
- Feature: Selecting a country opens a profile page with the exact life expectancy value, often broken down by gender, and supplementary data like GDP per capita, healthcare expenditure, or infant mortality where available.
- Benefit: Provides context beyond a single number, linking life expectancy to broader socio-economic variables.
Comparative Analysis Functionality
- Feature: Select two to five countries and view their life expectancy data side-by-side in bar or line charts.
- Benefit: Supports direct comparisons for research, policy analysis, and benchmarking.
Historical Data and Trend Analysis
- Feature: Many countries include historical life expectancy data, visualized through interactive line graphs spanning several decades.
- Benefit: Reveals patterns of improvement, stagnation, or decline, and shows how major events (wars, epidemics, economic shifts) affected health outcomes.
Filtering and Sorting Options
- Feature: Filter by year, continent, income level, or demographic group when supported by the source data. Sort tables by life expectancy, country name, or other parameters.
- Benefit: Narrows the dataset to specific research questions.
Data Export and Sharing Capabilities
- Feature: Download raw data (CSV, Excel) or export visualizations (PNG, SVG). Share directly to social media or email.
- Benefit: Integrates the data into reports, presentations, and further analysis.
Transparent Data Sourcing
- Feature: Each dataset cites its original source (WHO, World Bank, UN, national statistical offices).
- Benefit: Allows users to verify accuracy and review methodology.
Step-by-Step Guide on How to Use It
Step 1: Access the Tool
- Action: Open the tool's homepage in your browser.
- Tip: A stable internet connection helps when loading interactive maps and charts.
Step 2: Review the Global Overview
- Action: The homepage displays an interactive world map. Color shades represent varying longevity levels.
- Tip: Look for geographic clusters of high or low life expectancy to spot regional patterns.
Step 3: View Specific Country Data
- Action A (Map): Hover over a country to see its name and life expectancy for the selected year.
- Action B (Search): Type a country name in the search bar and select it from the dropdown.
- Action C (List): Use a sortable list of countries if available.
- Result: Clicking a country opens its dedicated profile page.
Step 4: Explore a Country Profile
- Action: The profile page typically includes:
- The average life expectancy value.
- Gender-based breakdowns.
- A line graph showing historical trends.
- Related socio-economic indicators where available.
- Tip: Use the year selector to examine how longevity has shifted over time.
Step 5: Compare Multiple Countries
- Action: Select a "Compare" or "Add to Comparison" option to view multiple countries side-by-side.
- Result: The tool generates a comparison chart (bar graph for a single year, multi-line graph for historical trends).
- Tip: Compare regional neighbors or countries with similar economic profiles to identify relevant factors.
Step 6: Apply Filters and Export Data
- Action A (Filter): Use dropdown menus to filter by year, continent, or income group.
- Action B (Sort): Click column headers in table view to sort by life expectancy, country name, or other metrics.
- Action C (Export): Download raw data or chart images using the "Download" or "Export" button.
- Tip: Combine filters to focus on specific regions or time periods for targeted analysis.
Use Cases
1. Researchers and Academics
- Use Case: Studying demographic shifts, public health outcomes, or the relationship between socio-economic indicators and longevity.
- Benefit: Standardized life expectancy data across many countries, with historical trends, reduces time spent on data collection.
2. Policymakers and NGOs
- Use Case: Identifying regions with pressing health challenges and evaluating the impact of existing policies.
- Benefit: A data-driven view of where resources are most needed and which strategies produce results.
3. Healthcare Professionals and Public Health Advocates
- Use Case: Understanding the global context of patient demographics, disease prevalence, and health system performance.
- Benefit: Highlights the broader determinants of health and the value of preventative care and equitable access.
4. Students and Educators
- Use Case: Teaching global geography, demographics, sociology, public health, and economics.
- Benefit: Converts abstract statistics into visual, interactive material for classroom use.
5. Journalists and Media Professionals
- Use Case: Sourcing verifiable statistics for articles, documentaries, or news reports.
- Benefit: Provides clear visualizations and sourced data to support stories on global health.
6. Travelers and Expatriates
- Use Case: Researching the health context of a destination before relocating or extended travel.
- Benefit: Offers a high-level view of public health infrastructure and life expectancy trends. This is not a substitute for medical advice.
7. Curious Individuals
- Use Case: Learning how countries compare and what drives human well-being.
- Benefit: Provides factual context about global health and longevity beyond headlines.
Frequently Asked Questions (FAQ)
Q1: What does "average life expectancy at birth" mean?
- A: Life expectancy at birth is the average number of years a newborn is expected to live if current mortality patterns persist throughout its life. It reflects overall health conditions, healthcare quality, living standards, and environmental factors at the time of calculation. It is an average and does not predict any individual's lifespan.
Q2: Where does the data come from?
- A: The data is sourced from international organizations and national agencies, including:
- World Health Organization (WHO): Primary source for global health statistics.
- World Bank: Development data including life expectancy.
- United Nations (UN): Demographic data from various UN divisions.
- National Statistical Offices: Official government bodies for country-level data. The tool cites each source for verification.
Q3: How often is the data updated?
- A: Major international bodies typically release updated figures annually or biennially. The tool incorporates the latest published data; check the "Last Updated" date for the current version.
Q4: Does the tool break down data by gender or other demographics?
- A: Many country profiles include gender-based life expectancy (male and female). Age group or urban/rural breakdowns are less common but may appear in advanced versions when source data supports them. Check individual country profiles for available filters.
Q5: Why do life expectancy figures vary so much between countries?
- A: Differences result from multiple interacting factors:
- Healthcare access and quality: Availability of doctors, hospitals, medicines, and preventative care.
- Socio-economic conditions: Poverty, income inequality, education, and employment.
- Nutrition and food security: Access to sufficient, nutritious food.
- Sanitation and hygiene: Clean water, sewage, and waste management.
- Lifestyle factors: Diet, exercise, smoking, and alcohol consumption.
- Environmental factors: Air and water pollution, climate impacts.
- Conflict and stability: Wars and humanitarian crises reduce longevity.
- Public health interventions: Vaccination programs, disease control, and maternal and child health initiatives.
Q6: Can I use this data for academic research or professional reports?
- A: Yes. The tool is designed for academic research, policy analysis, education, and professional reports. Cite the tool and its original data sources to maintain transparency.
Q7: Are there limitations to the data?
- A: Yes:
- Data availability and quality: Some countries have less reliable or incomplete data, particularly those with limited statistical infrastructure or active conflict.
- Averages mask variation: A single national figure can obscure differences between ethnic groups, income levels, or regions.
- Methodology differences: Variations in data collection or calculation between sources can affect comparability.
- Projections vs. actuals: Life expectancy is calculated from current mortality rates and does not account for future medical advances or unforeseen events.
Conclusion
The Life Expectancy by Country tool provides a clear, interactive view of demographic data that would otherwise require extensive research. By mapping longevity across nations and linking it to historical trends and socio-economic indicators, the tool supports researchers, policymakers, educators, journalists, and anyone interested in global health. Understanding the factors behind these numbers is a starting point for informed discussion about how to improve health outcomes worldwide.