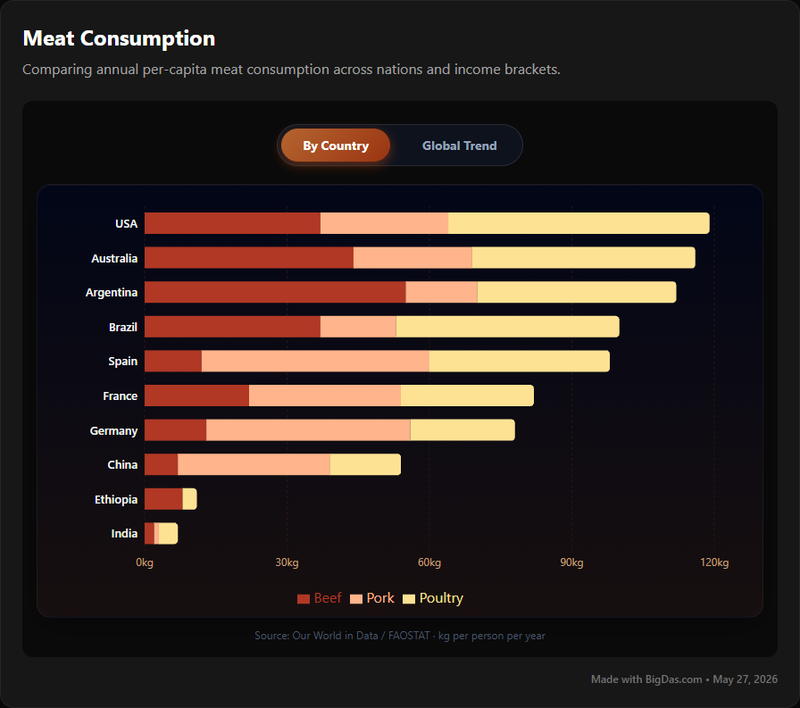
Meat Consumption by Country

Unveiling Global Dietary Landscapes: Exploring Meat Consumption by Country and Type
The global food system is a complex tapestry woven from cultural traditions, economic realities, environmental considerations, and personal choices. At its heart lies a fundamental component of human diets across millennia: meat consumption. Understanding how much meat is consumed, what types, and where, offers profound insights into public health, economic development, agricultural practices, and even geopolitical dynamics.
In a world increasingly driven by data, the ability to access, analyze, and interpret detailed information about our collective food habits is more critical than ever. This is precisely where the "Meat Consumption by Country" tool comes into its own, providing an indispensable resource for anyone seeking to navigate the intricate patterns of global meat consumption.
This comprehensive guide will delve into the power of this tool, exploring its features, demonstrating its utility, and illustrating how it transforms raw data into actionable knowledge. Prepare to journey through a world of fascinating dietary insights, brought to life through meticulous data presentation.

What is Meat Consumption by Country? A Deep Dive into Global Dietary Data
At its core, "Meat Consumption by Country" is a robust, interactive data visualization and analysis platform designed to illuminate per capita annual meat consumption figures from around the world. It provides a granular breakdown, not just by nation, but also by specific meat types, offering an unparalleled view into the nuanced dietary preferences and agricultural outputs that shape our planet.
Imagine being able to instantly compare the poultry consumption of Brazil with that of India, or observing the historical shift in pork consumption across Europe over several decades. This tool makes such detailed analysis not only possible but remarkably straightforward. It aggregates and presents complex statistical data in an accessible format, making it invaluable for researchers, policymakers, industry professionals, educators, and anyone with a keen interest in global food trends.
The data presented is typically measured in kilograms per person per year, providing a standardized metric for comparison. This per capita approach normalizes for population size, allowing for accurate comparative analysis between countries of varying demographics. By focusing on both country and meat type (e.g., beef, pork, poultry, lamb, goat, and sometimes others like game or offal), the tool offers a truly multi-dimensional perspective on global dietary patterns.
Key Features & Benefits: Transforming Data into Insight
The "Meat Consumption by Country" tool isn't just a database; it's a dynamic platform engineered for discovery and understanding. Its array of features and inherent benefits empower users to extract profound insights from vast datasets.
Powerful Features for Comprehensive Analysis:
- Granular Data Breakdown:
- By Country: Explore meat consumption statistics for virtually every nation on the globe, offering a truly global perspective.
- By Meat Type: Differentiate between major meat categories like beef & veal, pork, poultry (chicken, duck, turkey), lamb & goat, and often includes 'other meats' for a complete picture.
- Historical Trends: Access data spanning multiple years or even decades, enabling users to track long-term shifts in consumption patterns and identify emerging trends.
- Interactive Data Visualizations:
- Choropleth Maps: See geographical patterns at a glance, with countries color-coded based on their meat consumption levels, making global comparisons intuitive and visually striking. This is where data is beautiful truly shines, turning complex numbers into an engaging geographical narrative.
- Bar Charts & Line Graphs: Compare consumption levels across different countries or meat types with easy-to-read bar charts. Line graphs are perfect for visualizing historical trends over time, allowing for quick identification of upward or downward trajectories.
- Pie Charts: Understand the proportion of different meat types within a single country's overall meat diet.
- Customizable Filters and Search:
- Country Selector: Easily select one or multiple countries for focused analysis or comparison.
- Meat Type Filter: Isolate data for specific meat types to study their individual consumption patterns.
- Year Range Selection: Define a specific time period for your analysis, allowing you to focus on recent trends or long-term historical shifts.
- Comparison Functionality:
- Side-by-Side Analysis: Place multiple countries or meat types next to each other to directly compare their consumption figures and trends.
- Group Comparisons: Analyze average meat consumption for regions (e.g., continents, economic blocs) to understand broader geopolitical food patterns.
- Data Export Options:
- Download raw data in formats like CSV or Excel for further offline analysis and integration into your own reports or research.
- Export charts and maps as image files for presentations, publications, or educational materials.
Tangible Benefits for Diverse Users:
- Informed Decision-Making: For policymakers, businesses, and NGOs, accurate consumption data is paramount for strategic planning, resource allocation, and policy formulation related to food security, public health, and agricultural sustainability.
- Enhanced Research Capabilities: Academics and researchers gain access to a powerful dataset for studies on nutrition, economics, environmental impact, cultural food practices, and global dietary shifts.
- Market Intelligence: Food industry professionals can identify emerging markets, predict demand for specific meat products, and refine their supply chain strategies based on detailed consumption trends.
- Educational Resource: Teachers and students can use the tool to explore global geography, economics, and nutrition in a highly interactive and engaging manner, bringing data to life in the classroom.
- Personal Insight: Individuals interested in their own dietary footprint, global food systems, or understanding cultural differences can gain a deeper appreciation for the complexities of meat consumption worldwide.
- Visual Storytelling: The tool's emphasis on clear, beautiful data visualizations aids in communicating complex information effectively, making it easier to convey findings to a wider audience. The adage "data is beautiful" truly resonates here, as patterns and stories emerge visually that might be lost in tables of numbers.
Step-by-Step Guide: How to Use the Meat Consumption by Country Tool
Navigating the "Meat Consumption by Country" tool is designed to be intuitive and user-friendly, allowing you to quickly uncover the insights you seek. While the exact interface may vary slightly, the core functionalities remain consistent.
Here's a generalized step-by-step guide to get you started:
Step 1: Accessing the Tool
- Locate the Platform: Begin by navigating to the "Meat Consumption by Country" tool's website or dedicated portal. This might be part of a larger food or agricultural data hub.
Step 2: Initial Overview – The Global Landscape
- Default View: Upon loading, you'll likely be presented with a default global map or a summary dashboard. This initial view often displays aggregated meat consumption (all types combined) or a specific meat type for the most recent available year.
- Visual Cues: Pay attention to the legend accompanying the map or chart. It will indicate what the colors or bar lengths represent (e.g., darker shades for higher consumption, lighter for lower).
Step 3: Filtering Your Data – Pinpointing Your Focus
The power of the tool lies in its filtering capabilities. Look for filter panels or drop-down menus, usually located on the side or top of the interface.
- Select a Specific Country/Countries:
- Find a "Country Selector" or "Region Filter."
- Type the name of a country (e.g., "United States," "Brazil," "India") or select it from a list. You may be able to select multiple countries for comparison.
- Choose a Meat Type:
- Locate a "Meat Type Filter" or "Product Category" menu.
- Select the type of meat you're interested in (e.g., "Poultry," "Beef & Veal," "Pork," "Lamb & Goat," "All Meats").
- Define the Time Period:
- Look for "Year Range," "Start Year," or "End Year" selectors.
- Specify the year(s) you want to analyze. This allows you to focus on current trends or historical consumption patterns.
Step 4: Interpreting the Visualizations
Once you've applied your filters, the visualizations will update to reflect your selections.
- Maps (Choropleth):
- Hover over individual countries to see their exact consumption figures for the selected meat type and year.
- Observe geographical clusters of high or low consumption.
- Charts (Bar, Line, Pie):
- Bar Charts: Compare consumption levels between different countries or different meat types within a chosen country. The taller the bar, the higher the consumption.
- Line Graphs: Track consumption trends over time. An upward slope indicates increasing consumption, a downward slope decreasing. Look for spikes or dips that might correlate with historical events.
- Pie Charts: Understand the proportion of each meat type in a country's total meat diet. A larger slice means a higher percentage.
Step 5: Comparing and Contrasting
Many tools offer dedicated comparison features.
- Add for Comparison: Look for an "Add to Comparison" button or similar functionality when viewing a country's data. This allows you to overlay or display data for multiple selections side-by-side.
- Regional Averages: Some tools allow you to compare a country's consumption against regional or global averages, providing context.
Step 6: Exporting Your Findings
- Download Data: If you need the raw numbers, look for an "Export Data" or "Download CSV/Excel" button. This will provide a spreadsheet of the filtered data.
- Save Image: To include charts or maps in a report, presentation, or blog post, find an "Export Image" or "Download Chart" option. This typically saves the visualization as a PNG or JPEG file.
By following these steps, you can effectively navigate the "Meat Consumption by Country" tool and transform vast amounts of data into clear, actionable insights about global dietary patterns.
Why You Need This Tool: Unlocking Value Across Industries and Disciplines
The "Meat Consumption by Country" tool is far more than a simple data repository; it's a powerful engine for understanding, planning, and impacting the world around us. Its utility spans a wide array of sectors and interests.
For Researchers & Academics: Deepening Understanding of Food Systems
- Nutritional Studies: Investigate correlations between meat consumption patterns and public health outcomes (e.g., heart disease, obesity) across different populations.
- Environmental Impact Assessments: Quantify the potential ecological footprint (carbon emissions, water usage, land use) associated with varying national meat diets.
- Socio-Cultural Anthropology: Explore how cultural traditions, religious beliefs, and socio-economic factors influence meat preferences and consumption rates globally.
- Economic Analysis: Study the relationship between GDP per capita, food prices, and changes in meat consumption within developing and developed nations.
- Global Food Security: Analyze patterns to identify regions with potential protein deficiencies or over-reliance on specific meat types, informing strategies for sustainable food provision.
For Policymakers & Government Agencies: Informing Strategic Decisions
- Public Health Initiatives: Design targeted campaigns for healthier eating, potentially encouraging diversification of protein sources or moderation of certain meat types based on national trends.
- Agricultural Planning: Forecast demand for different meat types, guiding agricultural subsidies, import/export policies, and livestock farming strategies.
- Environmental Policy: Develop regulations and incentives for sustainable meat production and consumption, aligning with climate goals.
- Trade & Diplomacy: Understand global food demands and supply dynamics to inform trade agreements and international relations concerning agricultural products.
For Food Industry Professionals: Driving Market Insights and Innovation
- Market Analysis & Expansion: Identify high-growth markets for specific meat products or plant-based alternatives by observing consumption trends and dietary shifts.
- Product Development: Inform R&D efforts for new meat products or substitutes that align with evolving consumer preferences and health trends.
- Supply Chain Optimization: Forecast demand fluctuations for raw materials and finished products, leading to more efficient sourcing, production, and distribution.
- Investment Decisions: Guide investments in agricultural technologies, processing plants, or new food ventures by understanding long-term consumption trajectories.
For Health Professionals & Nutritionists: Guiding Dietary Advice
- Personalized Dietary Recommendations: Understand typical meat consumption in a patient's cultural or national context to offer more relevant and actionable dietary advice.
- Public Nutrition Education: Create data-backed educational materials that illustrate global or regional dietary patterns and their health implications.
- Trend Monitoring: Stay informed about global shifts in meat intake that could impact public health over time.
For Educators & Students: An Engaging Learning Resource
- Geography & Global Studies: Illustrate regional differences in food culture and agricultural practices.
- Economics: Demonstrate principles of supply and demand, international trade, and the impact of economic development on diet.
- Environmental Science: Provide real-world data for discussions on sustainable food systems and the ecological footprint of meat production.
- Nutrition & Health: Offer concrete examples of diverse dietary patterns and their potential health implications worldwide.
For Curious Individuals: Satisfying an Appetite for Knowledge
- Personal Dietary Awareness: Understand how your own meat consumption compares to national or global averages, offering a unique perspective on your place within the global food system.
- Cultural Exploration: Gain a deeper appreciation for the diverse food cultures and dietary habits that exist across the globe.
- Understanding Global Issues: Better grasp the complexities of food security, environmental sustainability, and public health by seeing the underlying data.
In every scenario, the "Meat Consumption by Country" tool stands out because it doesn't just present numbers; it fosters a deeper, more informed understanding of one of humanity's most fundamental relationships: our connection to food. It helps turn complex statistics into compelling narratives, proving that data is beautiful when it empowers profound insight.
Frequently Asked Questions (FAQ) about Meat Consumption Data
To help you make the most of the "Meat Consumption by Country" tool and understand the data it presents, here are answers to some common questions:
Q1: Where does the data for Meat Consumption by Country come from?
A: The data is typically sourced from reputable international organizations, national statistical agencies, and academic research institutions. Key sources often include the Food and Agriculture Organization of the United Nations (FAOSTAT), the OECD (Organisation for Economic Co-operation and Development), national ministries of agriculture, and comprehensive food consumption surveys. These sources collect and compile data from member countries, ensuring a standardized approach where possible.
Q2: How often is the data updated?
A: Update frequency can vary depending on the primary data sources. International organizations like the FAO usually release updated statistics annually, often with a lag of 1-2 years due to the time required for data collection, verification, and compilation from numerous countries. The "Meat Consumption by Country" tool aims to reflect the most current publicly available data as soon as it is processed.
Q3: What specific meat types are included in the breakdown?
A: The tool generally includes major meat categories such as:
- Beef & Veal
- Pork
- Poultry (often encompassing chicken, duck, and turkey)
- Lamb & Goat In some cases, it may also include categories like "other meats" (which might cover game, offal, or less common livestock) to provide a more complete picture of total meat consumption.
Q4: Is the data presented as 'raw' or 'processed' weight?
A: The figures usually represent carcass weight equivalent or retail weight equivalent, which accounts for the edible portion of the meat produced or consumed. This standardized measurement allows for consistent comparison across different countries and meat types, regardless of how the meat is eventually processed or prepared. It's important to note it often refers to availability for consumption, which is a close proxy for actual consumption but doesn't perfectly account for waste.
Q5: Can I compare specific countries side-by-side, or look at regional averages?
A: Absolutely. One of the core functionalities of the "Meat Consumption by Country" tool is its comparison feature. You can typically select multiple countries to view their consumption trends side-by-side in charts, or compare a single country against regional averages (e.g., North America, EU, Asia) to provide broader context.
Q6: How accurate is the data? Are there any limitations?
A: While the data is compiled from highly reputable sources using standardized methodologies, it's important to acknowledge inherent limitations:
- Data Collection Challenges: Not all countries have equally robust statistical collection systems, leading to potential variances in accuracy.
- Informal Economies: Some meat consumption (e.g., subsistence farming, illegal trade) may not be fully captured in official statistics.
- Definition Harmonization: While efforts are made to standardize, slight differences in how countries define or categorize meat types can exist.
- "Availability" vs. "Consumption": Often, the data reflects "food supply" or "food availability" per capita rather than actual ingested consumption, as it's harder to measure individual intake and account for household waste.
Despite these minor limitations, the data provided offers a highly reliable and comprehensive overview of global meat consumption patterns, making it an invaluable resource for broad analysis and trend identification.
Q7: Is the tool free to use, or is there a subscription fee?
A: The availability of the "Meat Consumption by Country" tool can vary. Many organizations that provide such data (like the FAO) make their raw data publicly accessible for free. Some advanced, interactive data visualization tools built on top of this data might offer premium features or require subscriptions for full access. For the purposes of this blog post, we are assuming it is a publicly accessible tool or at least has a substantial free tier, promoting broad utility.
Conclusion: Data-Driven Insights for a Sustainable Future
The "Meat Consumption by Country" tool stands as a testament to the power of well-presented data. In an increasingly interconnected world, understanding our global dietary patterns, particularly concerning meat consumption, is not merely an academic exercise; it's a critical component of addressing some of humanity's most pressing challenges.
From informing public health strategies and guiding sustainable agricultural practices to illuminating economic trends and enriching educational curricula, this tool demystifies complex statistics, transforming them into accessible, visual, and actionable insights. It serves as an indispensable resource for anyone seeking to understand the intricate relationship between food, culture, environment, and economy.
By providing a clear, granular breakdown of what meat is consumed, where, and by how much, the "Meat Consumption by Country" tool empowers a deeper, more informed conversation about our collective food future. It highlights not just numbers, but the stories behind them, painting a vivid picture of our global diet and contributing significantly to a more data-literate and sustainably-minded world. The profound impact of visualizing such comprehensive data truly demonstrates that data is beautiful when it fosters understanding and enables progress.