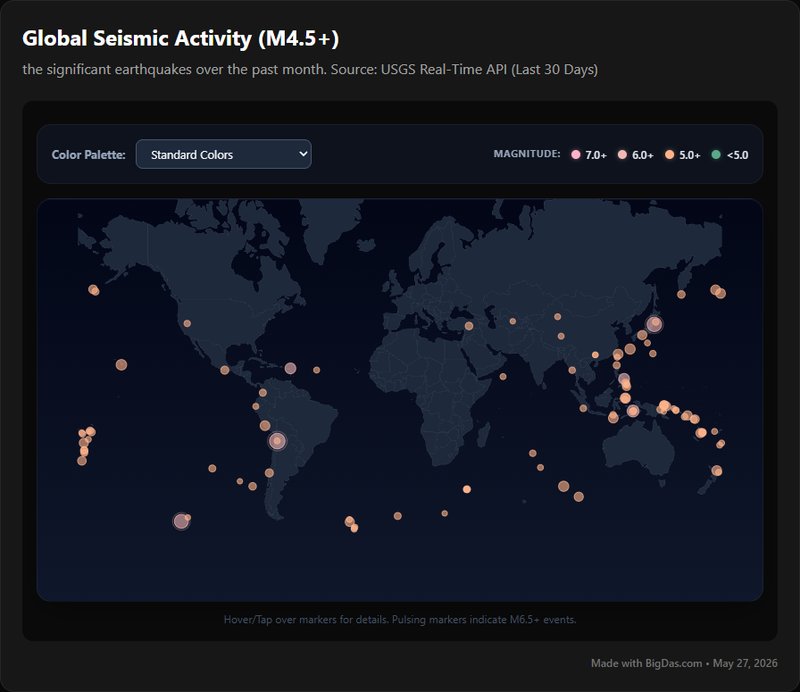
Recent Earthquakes (M4.5+)

Unveiling the Earth's Pulse: Monitoring Global Seismic Activity with Recent Earthquakes (M4.5+)
The ground beneath our feet often feels solid, immutable. Yet, it is a dynamic, constantly shifting canvas, shaped by the immense forces of plate tectonics. Earthquakes, those sudden tremors that remind us of this profound geological ballet, are a stark reminder of our planet's living nature. From minor shudders to devastating quakes, understanding these seismic events is crucial for awareness, safety, and scientific insight.
In a world increasingly connected, the need for real-time, accurate information about natural disasters is paramount. Whether you're a curious citizen, an educator, a researcher, or someone with family in an earthquake-prone region, staying informed about global earthquakes empowers you with knowledge. But how do you sift through the noise and access reliable, up-to-the-minute seismic data in an accessible format?
Enter Recent Earthquakes (M4.5+) – a powerful, intuitive online tool designed to bring the Earth's dynamic environment directly to your screen. This resource plots live global earthquake activity, specifically focusing on events with a magnitude of 4.5 or greater, making complex geological data digestible and visually compelling. It’s an exemplary demonstration of how data is beautiful when presented effectively for public understanding.

What is Recent Earthquakes (M4.5+)?
Recent Earthquakes (M4.5+) is an indispensable online platform that acts as a real-time global monitor for significant seismic events. At its core, the tool aggregates and visualizes earthquake data from reputable sources, primarily leveraging information from the U.S. Geological Survey (USGS). The "M4.5+" in its name signifies its focus: only earthquakes with a magnitude of 4.5 or greater are displayed, ensuring that users can quickly identify and track events with the potential for broader impact or those that are significant enough to be widely recognized.
The primary objective of Recent Earthquakes (M4.5+) is to provide an immediate and clear overview of where and when these geological occurrences are happening worldwide. Instead of sifting through raw data tables or complex scientific reports, users are presented with an interactive, geographical map that plots each event precisely by its epicenter and visually represents its magnitude. This design philosophy transforms complex seismic information into an easily understandable format, bridging the gap between scientific observation and public awareness. It’s a dedicated hub for anyone seeking to understand the ongoing earthquake activity that shapes our planet.
Key Features & Benefits
Recent Earthquakes (M4.5+) offers a suite of features designed to make global seismic monitoring both informative and user-friendly. These capabilities translate into tangible benefits for a diverse audience, from casual observers to those deeply invested in natural disaster preparedness.
Real-Time Global Seismic Activity Monitoring
- Feature: The platform continuously updates, displaying earthquake events as they happen around the globe. This live feed ensures that users always have access to the freshest seismic data available.
- Benefit: Staying informed about current earthquake occurrences is crucial for situational awareness, especially for individuals with interests in specific regions or those tracking general global seismic trends. It provides peace of mind or actionable knowledge depending on proximity to an event.
Interactive Geographic Visualization
- Feature: Earthquake epicenters are plotted directly onto an interactive world map. Each event is marked with a distinct visual indicator (often a circle), whose size and sometimes color correlate with its magnitude.
- Benefit: This visual approach makes it incredibly easy to grasp the geographical distribution and relative intensity of earthquakes at a glance. It eliminates the need to cross-reference location coordinates, making the data immediately understandable and engaging. It's a prime example of how data is beautiful when presented effectively.
Magnitude Filtering (M4.5+ Focus)
- Feature: The tool specifically highlights earthquakes of magnitude 4.5 and above. While some platforms display all tremors, this focus helps users concentrate on events of greater significance.
- Benefit: By filtering out smaller, less impactful tremors, the tool reduces clutter and allows users to quickly identify events that are more likely to be felt, cause damage, or be reported widely. This targeted approach is efficient for those seeking noteworthy seismic activity.
Detailed Event Information
- Feature: Clicking on any plotted earthquake event reveals a pop-up or sidebar with comprehensive details. This typically includes:
- Precise magnitude
- Exact time and date (often in UTC and local time)
- Depth of the earthquake
- Geographic location (latitude/longitude)
- Nearest populated place
- Link to the original USGS event page for further scientific analysis.
- Benefit: This granular information provides context and scientific depth, allowing users to move beyond a simple plot point to understand the specifics of each event. The direct link to USGS data ensures credibility and offers an avenue for deeper exploration.
User-Friendly Interface
- Feature: The design prioritizes simplicity and ease of navigation, even for those unfamiliar with geological terminology. The map is intuitive to pan and zoom, and information is presented clearly.
- Benefit: Accessibility is key. Whether you're a professional geophysicist or a concerned citizen, the tool is designed for immediate utility, requiring no specialized training to interpret its outputs. This broadens its appeal and ensures maximum helpfulness.
Educational Resource
- Feature: By providing a dynamic view of global seismic patterns, combined with detailed information, the tool serves as an excellent learning aid.
- Benefit: It offers a tangible, real-world context for understanding concepts like plate tectonics, seismic zones, and the impact of geological forces on our environment. Educators can use it to demonstrate live events, while students can explore and learn firsthand about ongoing natural disasters.
Contribution to Environmental Awareness
- Feature: Visualizing global earthquake activity underscores the dynamic nature of our planet.
- Benefit: This constant reminder of geological processes can foster a deeper appreciation for the Earth's powerful forces and the importance of scientific monitoring for understanding our environment.
These features collectively position Recent Earthquakes (M4.5+) as an essential resource for anyone interested in the Earth's seismic behavior, providing timely, accurate, and easily digestible information.
Step-by-Step Guide on How to Use It
Navigating Recent Earthquakes (M4.5+) is designed to be straightforward, allowing users to quickly access the seismic data they need. Here’s a simple guide to get you started and make the most of this powerful tool:
Step 1: Accessing the Platform
- Open your web browser: Type in the URL for "Recent Earthquakes (M4.5+)" (assuming it's available).
- Initial View: Upon loading, you'll typically be presented with an interactive world map. This map will immediately display a scatter of markers, each representing a recent earthquake event above magnitude 4.5.
Step 2: Understanding the Map Interface
- Earthquake Markers: Each circle or dot on the map signifies an earthquake epicenter.
- Size: Generally, the larger the circle, the higher the magnitude of the earthquake. This visual cue helps you quickly identify more significant events.
- Color (if applicable): Some versions of the tool might use color coding to indicate the recency of the event (e.g., brighter colors for very recent events, fading colors for older ones within the displayed timeframe) or even depth. Pay attention to any legend provided on the page.
- Zoom and Pan:
- Zoom In/Out: Use your mouse scroll wheel, the +/- buttons on the map, or pinch gestures on a touchscreen to zoom in for a more detailed view of specific regions or zoom out for a global perspective.
- Pan: Click and drag your mouse (or swipe on a touchscreen) to move the map around and explore different geographical areas.
Step 3: Exploring Specific Earthquake Events
- Click on a Marker: To get detailed information about a particular earthquake, simply click on its corresponding marker on the map.
- Information Panel: A pop-up window or a dedicated sidebar will appear, providing comprehensive details about that specific event. This panel typically includes:
- Magnitude: The precise numerical value (e.g., M4.7, M6.1).
- Time & Date: The exact timestamp of the earthquake, often provided in Universal Coordinated Time (UTC) and potentially your local time zone.
- Depth: The focal depth of the earthquake in kilometers.
- Location: Exact latitude and longitude coordinates, along with a description of the nearest geographical features or cities.
- Source Link: Crucially, there will almost always be a direct link to the original data source, most commonly the USGS event page. This allows you to verify the data and delve deeper into scientific reports, aftershocks, and related information.
Step 4: Interpreting the Data and Filtering (If Available)
While the core functionality of "Recent Earthquakes (M4.5+)" is to display M4.5+ events globally, some versions may offer additional filters or display options:
- Timeframe Slider/Selection: Look for options to filter earthquakes by how recent they are (e.g., past hour, past 24 hours, past 7 days). This can help you focus on the very latest activity or review recent patterns.
- Magnitude Slider/Selection: Though the tool focuses on M4.5+, some advanced interfaces might allow you to adjust the minimum magnitude displayed (e.g., if you only wanted to see M6.0+ events).
- Region/Area of Interest: Some tools allow you to draw a box or select a region to filter earthquakes within a specific geographic boundary.
- List View: Often, alongside the map, there's a list view presenting the same earthquake data in chronological order, sometimes sortable by magnitude or location. This can be useful for quickly scanning recent events without needing to interact with the map.
Step 5: Utilizing the USGS Link for Deeper Insights
The link to the USGS event page is a goldmine for those seeking more scientific detail. On the USGS site, you can typically find:
- More detailed seismic parameters.
- Interactive maps showing shake intensity.
- Information on aftershocks.
- Tectonic summaries of the region.
- User-submitted felt reports.
By following these steps, you can effectively use Recent Earthquakes (M4.5+) to stay informed, explore seismic patterns, and gain a clearer understanding of our dynamic planet's ongoing activity.
Why You Need This Tool (Use Cases)
The Recent Earthquakes (M4.5+) tool isn't just a static display of data; it's a dynamic resource that provides critical insights for a wide array of users. Its value extends beyond mere curiosity, touching on aspects of safety, education, research, and environmental awareness.
1. For Emergency Preparedness and Situational Awareness
- Scenario: You have family living in a seismically active region, or you're planning a trip to such an area.
- Value: This tool provides immediate, credible information about recent significant earthquakes. While it's not an early warning system, it allows you to quickly check if a significant event has occurred in a region of concern. This knowledge can inform decisions, trigger communication with loved ones, or simply provide peace of mind by confirming an area is currently calm. Staying aware of global natural disasters is a key step in personal and community resilience.
2. For Educators and Students
- Scenario: A geography teacher is explaining plate tectonics, or a student is researching global seismic patterns for a project.
- Value: Textbooks and diagrams are helpful, but a live, interactive map showing real-time earthquakes brings the subject to life. Educators can use it to demonstrate the "Ring of Fire," the formation of new crust, or the interaction of tectonic plates as it happens. Students can visualize concepts, track actual seismic events, and connect theoretical knowledge to tangible, ongoing geological processes in our environment. It makes the abstract concept of the Earth's moving crust profoundly real.
3. For Researchers and Geologists (Quick Overview)
- Scenario: A seismologist needs a rapid global overview of recent significant earthquakes before diving into more detailed analysis, or a geologist wants to quickly contextualize a specific regional study.
- Value: While USGS provides the raw, detailed data, the visual and immediate nature of Recent Earthquakes (M4.5+) offers an excellent first-glance dashboard. It quickly highlights areas of current activity, helping researchers identify trends, anomalous events, or regions requiring deeper investigation without sifting through extensive data tables initially. It serves as an accessible interface to the rich USGS data.
4. For Travelers and Expats
- Scenario: You're about to embark on an international trip, or you reside in a foreign country and want to monitor the local seismic situation.
- Value: Understanding the seismic context of your destination or current residence is an important aspect of safety awareness. The tool allows you to quickly check for recent significant earthquakes in a specific country or region, providing valuable information for your travel preparations or ongoing living situation.
5. For "Data is Beautiful" Enthusiasts and Visual Learners
- Scenario: You appreciate elegant data visualization and want to observe natural phenomena through a compelling interface.
- Value: The tool transforms complex seismic data into an easily digestible, visually appealing map. Watching the earthquake markers appear and understanding their scale at a global level is not only informative but also aesthetically engaging. It demonstrates how science can be presented in an accessible and captivating manner, highlighting the beauty and power of our planet's processes.
6. For Environmental Awareness and Advocacy
- Scenario: You are interested in understanding the dynamic forces shaping our planet and their potential impact on ecosystems and human populations.
- Value: Monitoring earthquakes provides a tangible connection to the Earth's powerful internal processes. It reinforces an understanding of how our environment is constantly changing and the significant role that natural disasters play in these transformations. This awareness can contribute to discussions about sustainable development, resilient infrastructure, and our interaction with geological hazards.
In essence, Recent Earthquakes (M4.5+) transcends its technical description to become a vital resource for anyone seeking to connect with the planet's pulse, understand natural disasters, and leverage accurate USGS-sourced seismic data for various personal, professional, or educational needs.
FAQ Section
Here are some frequently asked questions about monitoring earthquakes and using tools like Recent Earthquakes (M4.5+):
Q1: What does "M4.5+" mean in "Recent Earthquakes (M4.5+)"?
A: "M4.5+" refers to earthquakes with a magnitude of 4.5 or greater on the Richter or moment magnitude scale. The tool specifically focuses on displaying events of this magnitude and above, as they are generally considered significant enough to be felt over wider areas, cause minor to moderate damage near the epicenter, and are reliably recorded by global seismic networks.
Q2: How frequently is the data updated?
A: The data on Recent Earthquakes (M4.5+) is typically updated in near real-time. As soon as a significant earthquake is detected, processed, and confirmed by its primary data source (e.g., the USGS), it will appear on the map, often within minutes of the event occurring. This rapid updating ensures that you have access to the latest seismic data.
Q3: What is the primary source of the earthquake data?
A: The primary source for the earthquake data displayed on Recent Earthquakes (M4.5+) is the U.S. Geological Survey (USGS). The USGS is a leading scientific agency that monitors and assesses earthquake hazards worldwide, providing authoritative and continuously updated seismic information. Links to the original USGS event pages are typically provided for each earthquake for deeper investigation.
Q4: Can I view historical earthquakes using this tool?
A: While Recent Earthquakes (M4.5+) focuses on recent activity, the specific timeframe might vary. Most such tools typically display events from the last 24 hours to the last 7 or 30 days. For extensive historical earthquake data stretching back years or decades, you would need to visit the USGS website directly or specialized seismic archives, which offer comprehensive search and filtering capabilities for past events.
Q5: Why are some regions more prone to earthquakes than others?
A: Earthquakes are concentrated along the boundaries of the Earth's tectonic plates. These plates are constantly moving, grinding past each other, pulling apart, or colliding. The immense stress built up at these boundaries is released in sudden slips, causing earthquakes. Regions like the Pacific Ring of Fire, the Himalayas, and the Mediterranean-Alpine belt are highly active because they lie on or near major plate boundaries. This global pattern of seismic activity is clearly visible when using the tool.
Q6: What's the difference between magnitude and intensity?
A:
- Magnitude is a measure of the energy released at the source of the earthquake, determined from seismograph readings. It's a single number for each event (e.g., M5.0, M7.2).
- Intensity describes the effects of an earthquake at a particular location. It's based on observed effects (e.g., how strongly the ground shook, amount of damage). Intensity varies with distance from the epicenter and local geology. Tools like Recent Earthquakes (M4.5+) primarily display magnitude data, while the linked USGS pages often provide intensity maps.
Q7: Why is monitoring global earthquakes important for the environment?
A: Monitoring global earthquakes helps us understand the dynamic processes that shape our planet's environment. Seismic activity can lead to tsunamis, landslides, and changes in landforms, impacting ecosystems and human infrastructure. Continuous monitoring provides data for hazard assessment, urban planning, and the development of early warning systems, contributing to a more resilient interaction between human societies and the natural environment. It highlights the ongoing geological forces that influence everything from topography to resource distribution.
Q8: Is there an official app for "Recent Earthquakes (M4.5+)"?
A: The availability of an official app depends on the specific developers of the "Recent Earthquakes (M4.5+)" tool. Many such platforms are web-based, optimized for mobile browsers. It's best to check the website itself for any links to official mobile applications or recommended third-party apps that utilize similar USGS data feeds.
Conclusion
The Earth is a living, breathing planet, and nowhere is this more evident than in its relentless seismic activity. Recent Earthquakes (M4.5+) stands as a testament to the power of accessible data, transforming complex USGS seismic readings into a global, interactive narrative. It demystifies the science behind earthquakes, allowing anyone to observe the planet's pulse in real-time.
By providing a clear, visually engaging, and continuously updated map of significant earthquakes worldwide, this tool serves as a vital resource. It fosters greater understanding of natural disasters, aids in cultivating personal and community awareness, and offers a unique educational window into the geological forces that sculpt our environment. For those who appreciate how data is beautiful when it informs and engages, or simply seek to stay informed about the dynamic nature of our world, Recent Earthquakes (M4.5+) offers invaluable insight into the Earth's ongoing story.