
USD Exchange Rates

USD Exchange Rates: A Focused Look at the Dollar Against EUR, GBP, and CNY
The US Dollar (USD) moves against the Euro (EUR), British Pound (GBP), and Chinese Yuan (CNY) every trading day. These three pairs cover the bulk of global forex activity involving the dollar and reflect the economic relationship between the US and its largest trading partners. Tracking them over the past year gives a practical view of how the dollar has performed and where it stands now.
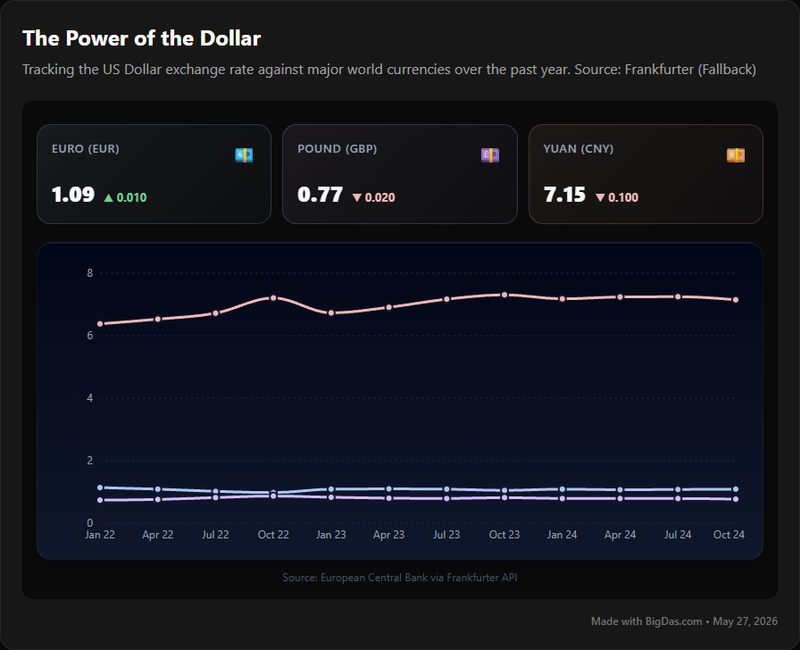
The USD Exchange Rates tool provides this view. It pulls historical daily rates for USD/EUR, USD/GBP, and USD/CNY, and plots them on interactive charts. The interface is built for quick analysis: select a pair, read the chart, hover for exact values, and switch between pairs to compare.
What the Tool Does
The USD Exchange Rates tool tracks the US Dollar against three currencies over a rolling 12-month window. It is not a live conversion calculator. It is a historical viewer designed to show trend, volatility, and relative performance.
The three pairs are selected for a reason. The Eurozone, the United Kingdom, and China together account for the largest share of US trade and capital flows outside North America. Movements in these pairs correlate with major macroeconomic events: central bank rate decisions, GDP releases, trade balance shifts, and geopolitical developments.
By limiting the scope to these three pairs and a one-year window, the tool keeps the data focused. Users can:
- Read the trend: Is the dollar gaining or losing ground against a given currency?
- Spot volatility: How wide are the swings, and how often do they occur?
- Identify key turning points: When did the rate peak or trough, and what was happening in the markets at that time?
- Compare pairs: Does the dollar move uniformly against all three, or does it strengthen against one while weakening against another?
Key Features
1. Three Pairs, No Noise
The tool covers USD/EUR, USD/GBP, and USD/CNY. No other currencies are shown. This is a deliberate choice: it removes the distraction of dozens of minor pairs and keeps attention on the relationships that matter most for trade, investment, and policy analysis.
2. Twelve-Month Historical View
A single day's rate is a data point. A year of daily rates is a record. The 12-month window is long enough to show multi-month trends and short enough to stay relevant. Users can look for:
- Sustained uptrends or downtrends
- Seasonal patterns
- Comparison points: where is the rate today versus three, six, or twelve months ago
3. Interactive Charts
Each pair is plotted as a line chart with time on the x-axis and exchange rate on the y-axis. Hovering over a point shows the exact rate for that date. The chart updates immediately when a different pair is selected.
4. Pair Comparison
Switching between USD/EUR, USD/GBP, and USD/CNY makes it easy to see how the dollar behaves against each. If the dollar rises against the Euro but falls against the Pound, the divergence points to currency-specific factors rather than broad dollar strength.
5. Context for Economic Events
The chart provides a timeline. Users can overlay their knowledge of economic events (rate decisions, elections, trade negotiations) onto the rate movements to build a cause-and-effect picture.
How to Use the Tool
Step 1: Open the Tool
Navigate to the USD Exchange Rates section. The default view typically loads the USD/EUR chart for the past year.
Step 2: Select a Currency Pair
Use the pair selector to choose USD/EUR, USD/GBP, or USD/CNY. The chart and any displayed data update to match.
Step 3: Read the Chart
- Y-axis (vertical): The exchange rate. For USD/EUR, this is euros per dollar. For USD/GBP, pounds per dollar. For USD/CNY, yuan per dollar.
- X-axis (horizontal): Time, running left to right from one year ago to the most recent available date.
- Upward slope: The dollar is buying more of the foreign currency over that span.
- Downward slope: The dollar is buying less.
- Flat line: Relative stability.
- Peaks and troughs: The dollar's strongest and weakest points against that currency over the year.
- Steepness and frequency of changes: Indicates volatility.
Step 4: Hover for Exact Values
Move the cursor along the line to see the closing rate for specific dates. This is useful for checking the rate on a particular day or correlating it with a known event.
Step 5: Compare Pairs
Switch to a second pair and compare the shape of the chart. Similar shapes suggest a common driver (US-side factor). Divergent shapes suggest currency-specific factors on the other side.
Step 6: Apply the Information
- Business: Inform pricing on imports/exports, budget for international payroll, plan hedging.
- Trading: Identify the macro trend, set risk parameters based on observed volatility.
- Travel: Time currency exchange to when the dollar has historically been stronger.
- Research: Build a dataset for analysis or use the chart as a teaching example.
Use Cases
International Businesses
Companies that import, export, or operate across borders carry currency risk. A 5% swing in USD/EUR can change the margin on a large order. The tool helps finance teams see how the dollar has moved against the currencies they transact in, and where the rate sits relative to its 12-month range. That information feeds into pricing, budgeting, and hedging decisions.
Forex Traders and Investors
Traders use the 12-month chart to identify the prevailing trend (up, down, or range-bound) and to gauge typical volatility. Both inform position sizing and stop-loss placement. Long-term investors with foreign holdings can check the currency exposure on their positions.
Travelers and Expats
Someone planning a trip to Europe, the UK, or China can see when the dollar was strongest over the past year. Expats managing remittances or budgeting in a foreign currency can monitor the trend to time transfers.
Analysts and Researchers
The historical series is a usable dataset. It can be exported (where the feature is available) for statistical work, or used directly in the chart to correlate rate movements with economic releases, policy changes, or geopolitical events.
Individuals with International Finances
Anyone sending remittances, paying international invoices, or buying from foreign retailers can check the rate history to understand whether the current rate is favorable compared to the recent past.
FAQ
Q1: What is an exchange rate?
An exchange rate is the price of one currency expressed in terms of another. A USD/EUR rate of 0.92 means one US Dollar buys 0.92 Euros.
Q2: Why do USD exchange rates move?
Several factors drive short- and medium-term movements:
- Interest rate differentials: Higher US rates relative to other countries tend to support the dollar.
- Economic data: Growth, employment, and inflation prints move expectations and the currency.
- Trade flows: Persistent trade deficits can weigh on the dollar over time.
- Policy and political developments: Central bank guidance, fiscal policy, and political stability all factor in.
- Market positioning: Speculative positioning can amplify moves in either direction.
Q3: How often is the data updated?
Daily. The tool uses end-of-day or average daily rates to build the 12-month series.
Q4: What does a "strong" or "weak" dollar mean?
A strong dollar buys more foreign currency than before. USD/EUR moving from 0.92 to 0.95 means the dollar strengthened. A weak dollar buys less. The same move in the opposite direction (0.92 to 0.88) means the dollar weakened.
Q5: Why only EUR, GBP, and CNY?
These three cover the most economically significant relationships the US has with the rest of the world: the Eurozone, the UK, and China. Limiting the tool to these pairs keeps the focus on high-impact data.
Q6: Can I download the data?
Many implementations include a CSV export. Check the tool interface for an "Export" or "Download" option.
Q7: How far back does the data go?
Exactly 12 months from the current date. The window updates as time passes.
Q8: Is this suitable for beginners?
Yes. The interface is visual, the scope is limited, and the interpretation rules are straightforward. It works as a learning tool for anyone new to forex.
Summary
The USD Exchange Rates tool is a focused historical viewer for three currency pairs over the past year. It covers USD/EUR, USD/GBP, and USD/CNY, plots them on interactive charts, and lets users compare them side by side. The data is daily, the window is 12 months, and the interface is built for quick interpretation.
It serves a specific purpose: giving businesses, traders, travelers, and analysts a clear read on where the dollar has been against its most important counterparts. For anyone whose financial decisions are touched by these exchange rates, that context is directly useful.