AM/FM Modulation
 Modern scientific illustration of AM/FM Modulation
Visualize the Invisible: The Ultimate AM/FM Modulation Tool for Signal Analysis
In the world of telecommunications and signal processing, few concepts are as fundamental—and yet as frequently misunderstood—as modulation. Whether you are tuning into your favorite radio station, setting up a Ham radio, or diving into the physics of wireless communication, the invisible dance between a message signal and a carrier wave is happening all around you.
However, understanding the mathematics behind Amplitude Modulation (AM) and Frequency Modulation (FM) is one thing; visualizing how they actually behave in real-time is another challenge entirely. Static textbook diagrams often fail to convey the dynamic nature of signal alteration.
Enter our best-in-class AM/FM Modulation Tool. This interactive simulator bridges the gap between abstract theory and practical reality, allowing engineers, students, and hobbyists to see exactly how a message signal alters a carrier wave.
In this deep dive, we will explore the mechanics of modulation, the distinct differences between AM and FM, and how you can leverage this tool to master signal processing.
What is AM/FM Modulation? (A Deep Dive)
Before we demonstrate the power of the tool, it is crucial to understand the physics it simulates. At its core, modulation is the process of varying one or more properties of a periodic waveform, called the carrier signal, with a separate signal called the message signal (or modulating signal) that contains information to be transmitted.
Without modulation, we couldn't send audio signals over long distances wirelessly; low-frequency audio waves simply don't have the energy to travel far. Modulation allows us to "piggyback" voice and music onto high-frequency radio waves.
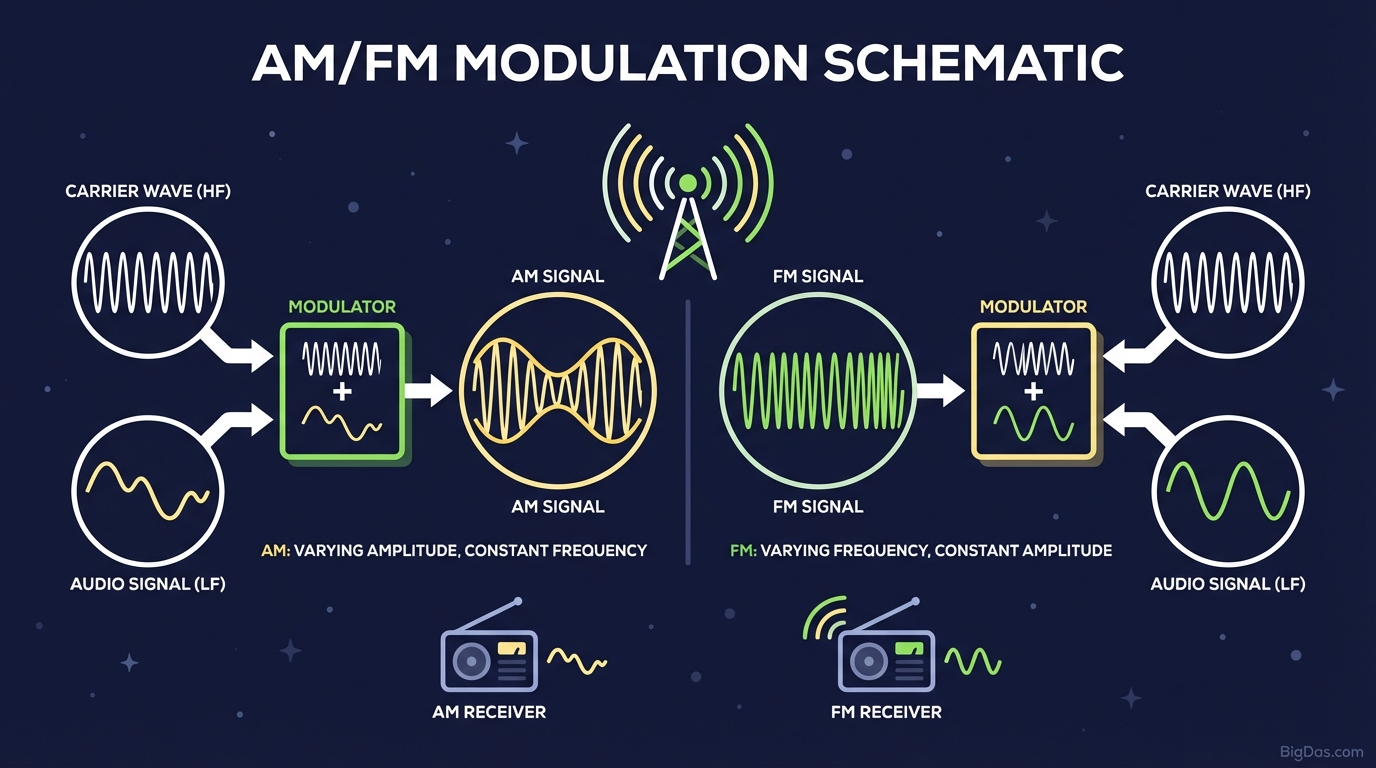
1. Amplitude Modulation (AM)
In Amplitude Modulation, the strength (amplitude) of the carrier wave is varied in proportion to the message signal, while the frequency remains constant.
- The Visualization: When you use our tool to view AM, you will see the carrier wave's height growing and shrinking.
- The "Envelope": The most distinct feature you will observe is the "envelope." The peaks of the modulated carrier wave trace out the exact shape of your original message signal.
- The Physics: This is the oldest form of radio transmission. It is simple to implement but susceptible to noise, as electrical interference usually affects the amplitude of a signal (manifesting as static).
2. Frequency Modulation (FM)
In Frequency Modulation, the frequency (speed of oscillation) of the carrier wave is varied in proportion to the message signal, while the amplitude remains constant.
- The Visualization: On our tool, an FM wave looks like a slinky being compressed and stretched. As the message signal creates a peak, the carrier waves bunch up (higher frequency); as the message dips, the carrier waves spread out (lower frequency).
- Noise Immunity: Because the amplitude never changes, FM is far more resistant to static and signal degradation, which is why FM radio sounds cleaner than AM radio.
Key Features & Benefits of This Tool
Why is this specific AM/FM Modulation Tool considered the industry standard for visualization? It goes beyond simple graphing; it provides a laboratory-grade simulation environment accessible directly from your browser.
1. Real-Time Dynamic Rendering
Unlike static calculators that generate a single image, this tool renders waveforms dynamically. You can see the cycles flowing, providing a temporal understanding of how the signal evolves over time.
2. Precision Parameter Control
You aren't stuck with presets. You have full control over:
- Message Frequency ($f_m$) & Amplitude ($A_m$): Control the "sound" you are sending.
- Carrier Frequency ($f_c$) & Amplitude ($A_c$): Control the "transport" wave.
- Modulation Index: Instantly see the effects of changing the modulation index ($\beta$ or $m$), which is critical for understanding bandwidth and efficiency.
3. Dual-View Comparison
The tool allows for a split-screen or overlaid view, enabling you to compare how the exact same message signal looks when modulated via AM versus FM instantly. This is invaluable for comparative analysis.
4. High-Resolution Waveform Analysis
The rendering engine is optimized for high-density displays, ensuring that even when the carrier frequency is significantly higher than the message frequency, distinct cycles are visible without aliasing artifacts.
Step-by-Step Guide: How to Use the AM/FM Modulation Tool
Ready to simulate your first signal? Follow this guide to get the most out of the interface.
Step 1: Set Your Carrier Wave
Locate the Carrier Settings. Set your frequency ($f_c$).
- Tip: Start with a carrier frequency that is at least 10x higher than your message frequency for a clear visual. If they are too close, the waveform will look chaotic (aliasing).
Step 2: Input Your Message Signal
Go to the Message Settings. This represents the data (voice/music) you want to send.
- Set a lower frequency ($f_m$) compared to the carrier.
- Adjust the amplitude ($A_m$).
Step 3: Choose Your Modulation Mode
Toggle between AM and FM.
- For AM: Watch the "Envelope." If you increase the Message Amplitude too high, watch for over-modulation, where the wave "pinches" off at the center line, causing distortion. The tool visualizes this perfectly.
- For FM: Watch the density of the waves. Increase the Message Amplitude to increase the frequency deviation (how much the frequency changes).
Step 4: Analyze the Modulation Index
This is the pro feature.
- AM Index ($m = A_m / A_c$): Try to get this to exactly 1.0 (100% modulation). Go above 1.0 to see distortion.
- FM Index ($\beta$): Increase this to see "Wideband FM," where the bandwidth requirements expand significantly.
Why You Need This Tool (Use Cases)
Who benefits from a high-fidelity modulation simulator?
1. Electrical Engineering Students & Educators
Textbooks are notorious for making modulation confusing. This tool serves as the ultimate study aid. It allows students to visually verify their homework calculations regarding modulation indices and sidebands. Teachers use it to project live demonstrations during lectures.
2. Ham Radio Operators & Hobbyists
If you are studying for your Amateur Radio license (Technician, General, or Extra), understanding the difference between signal types is mandatory. This tool helps you visualize why over-modulating your AM rig causes splatter, or how FM deviation affects your signal clarity.
3. Audio Engineers & Synthesists
FM Synthesis (popularized by synthesizers like the Yamaha DX7) creates complex timbres using frequency modulation in the audio range. Sound designers can use this tool to visualize how operators interact to create metallic or bell-like tones.
4. RF System Designers
Before firing up an expensive vector signal generator or oscilloscope, engineers can use this tool for quick "napkin math" visualization to verify carrier-to-message ratios and expected waveform behaviors.
How to Get the Most Out of This Tool (Expert Tips)
To move from a casual user to a power user, keep these tips in mind:
- Visualize Over-Modulation: In AM, force the message amplitude to be higher than the carrier amplitude. You will see the phase reversal at the zero-crossing. This helps you understand why "clipping" sounds so bad in audio equipment.
- The FM "Freeze": In FM, try to find the modulation index where the carrier component actually disappears (known as the Bessel null). While the tool visualizes the time domain, knowing that you can manipulate the wave to specific deviation points is a powerful concept.
- Slow Down: If the tool offers a time-scale or speed slider, slow it down. The human eye tracks amplitude changes (AM) easily, but frequency changes (FM) are harder to track at high speeds. Slowing the simulation reveals the "accordion" effect of the FM wave.
Frequently Asked Questions (FAQ)
1. What is the main difference between AM and FM?
The main difference lies in what characteristic of the carrier wave changes. In AM (Amplitude Modulation), the height of the wave changes based on the data. In FM (Frequency Modulation), the spacing (frequency) of the wave changes, but the height remains constant.
2. What happens if the Modulation Index is greater than 1 in AM?
This causes over-modulation. Visually, the wave envelope crosses the zero axis, leading to severe distortion and the generation of unwanted sideband frequencies (splatter) that can interfere with other channels.
3. Why is FM sound quality generally better than AM?
FM is superior in noise rejection. Most environmental noise (lightning, power lines, motors) creates spikes in amplitude. Since FM receivers track frequency changes and ignore amplitude changes (using a limiter), they filter out this static. AM receivers, by definition, must listen to amplitude changes, so they "hear" the static.
4. Can this tool simulate Phase Modulation (PM)?
While this tool focuses on AM and FM, PM is very similar to FM. In fact, FM is effectively the integral of PM. If you understand the visual representation of FM on this tool, you have a strong conceptual grasp of PM as well.
5. Is this tool helpful for understanding synthesizer LFOs?
Absolutely. A Low-Frequency Oscillator (LFO) modulating the volume of a synth patch is AM (Tremolo). An LFO modulating the pitch of a synth patch is FM (Vibrato). This tool visualizes exactly what your synthesizer is doing.
Conclusion
Signal modulation is the invisible backbone of modern communication. From the Wi-Fi in your home to the radio in your car, the principles of varying a carrier wave dictate how we connect with the world.
The AM/FM Modulation Tool is more than just a calculator; it is a lens into the physics of information transfer. By manipulating the carrier and message signals in real-time, you move past rote memorization and achieve true intuitive understanding.
Don't just read about signal theory—experience it.
> Launch the AM/FM Modulation Simulator Now <
Start experimenting with different frequencies and amplitudes today, and see the invisible waves that power our world come to life.