I2C & SPI Bus Simulation
 Modern scientific illustration of I2C & SPI Bus Simulation
Master Serial Communication: The Ultimate Guide to I2C & SPI Bus Simulation
Category: Electronics Engineering / Embedded Systems
Reading Time: 8 Minutes
In the world of embedded systems and digital electronics, invisible data streams are the lifeblood of your hardware. Whether you are connecting a temperature sensor to an Arduino or designing a complex PCB with multiple microcontrollers, the way chips talk to each other dictates your success.
But here is the problem: You cannot see electricity.
When communication fails, you are often left staring at a black box. Is it a bad solder joint? A wrong pull-up resistor? Or did you mess up the clock polarity in your firmware? Traditionally, solving these mysteries required expensive logic analyzers, oscilloscopes, and hours of frustration.
Enter the I2C & SPI Bus Simulation tool—the best-in-class, interactive visualizer that brings these invisible protocols to light. In this guide, we will deep dive into how this tool works, why it is superior to standard debugging methods, and how you can use it to master serial communication.
What is I2C & SPI Bus Simulation?
To appreciate the power of this simulation tool, we must first understand the protocols it visualizes. The I2C & SPI Bus Simulation is a web-based, interactive logic analyzer that renders the theoretical behavior of the Inter-Integrated Circuit (I2C) and Serial Peripheral Interface (SPI) protocols in real-time.
It bridges the gap between abstract code and physical reality. Instead of reading a 100-page datasheet to understand a timing diagram, this tool lets you create those diagrams dynamically.
Understanding the Protocols
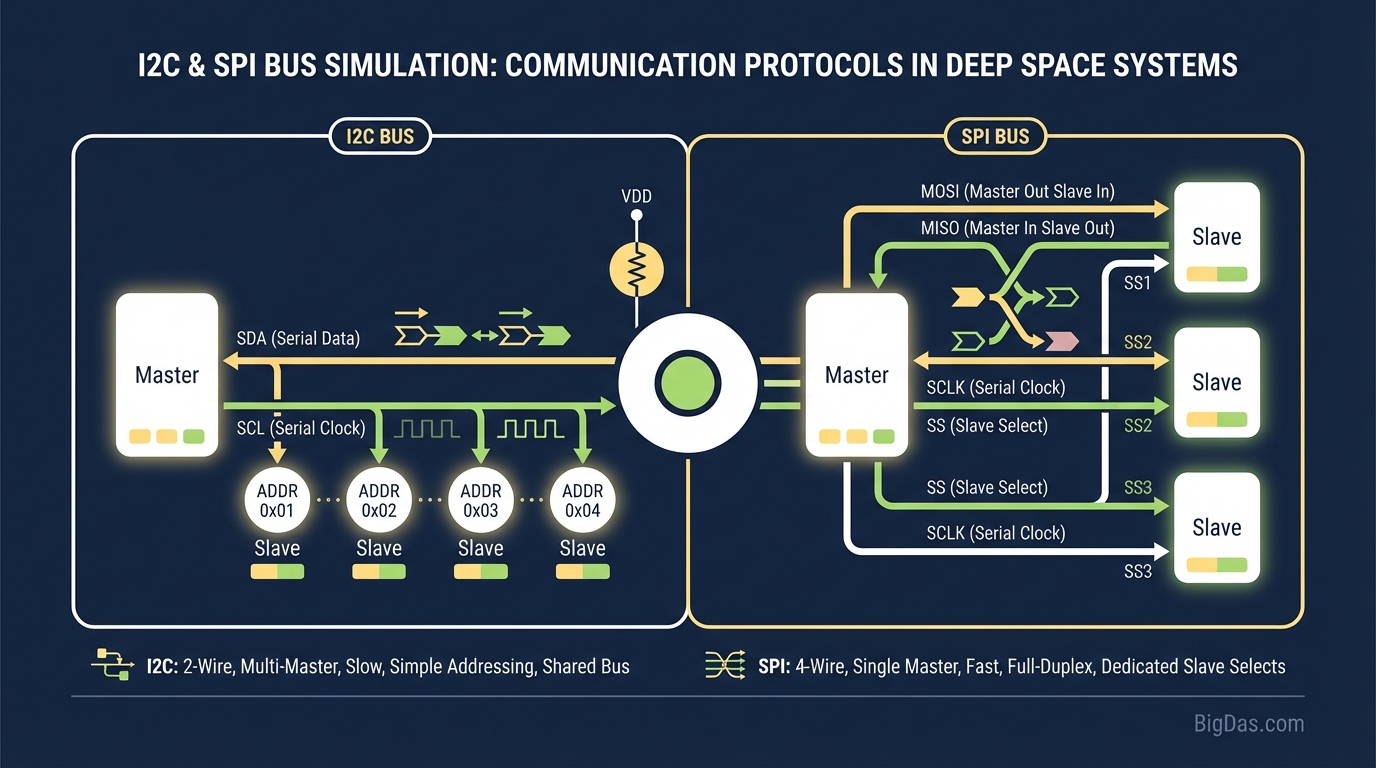
1. I2C (Inter-Integrated Circuit)
I2C is the "cooperative" protocol. It uses only two wires:
- SDA (Serial Data): The line where data moves back and forth.
- SCL (Serial Clock): The line that keeps time.
It is famous for being simple to wire but complex to debug because it relies on accurate addressing, acknowledgement bits (ACK/NACK), and strict timing constraints like clock stretching.
2. SPI (Serial Peripheral Interface)
SPI is the "speed demon." It typically uses four wires:
- MISO (Master In Slave Out): Data from Slave to Master.
- MOSI (Master Out Slave In): Data from Master to Slave.
- SCK (Serial Clock): The clock pulse.
- CS/SS (Chip Select/Slave Select): Determines which device is being spoken to.
SPI is faster than I2C but notorious for configuration mismatches regarding Clock Polarity (CPOL) and Clock Phase (CPHA).
The Simulation Tool takes these definitions and creates a virtual sandbox. It allows you to act as the "Master" device, sending commands to virtual "Slave" devices, and visually displays exactly how the voltage levels on the wires change over time.
Key Features & Benefits
Why is this specific I2C & SPI Bus Simulation tool considered the industry standard? It goes beyond static images. It simulates the physics and logic of the bus.
1. Real-Time Waveform Visualization
The core feature is the dynamic timing diagram. As you input data (Hex, Binary, or ASCII), the tool draws the square waves for clock and data lines immediately. You can see the relationship between the rising edge of the clock and the validity of the data bit—a concept that stumps 90% of engineering students.
2. Interactive Protocol Configuration
Most simulators are rigid. This tool allows you to tweak the "physical" parameters:
- Switch SPI Modes: Instantly toggle between SPI Modes 0, 1, 2, and 3 to see how CPOL and CPHA alter the data sampling edge.
- I2C Addressing: Change 7-bit addresses and see how the Read/Write bit is appended.
- Clock Speed Emulation: Visualize how baud rate differences impact transmission time.
3. Error Injection & Analysis
This is where the tool shines for professionals. You can simulate error states. What happens if the Slave device holds the clock line low (Clock Stretching)? What does a NACK look like on the SDA line? The tool highlights these events in red, teaching you how to identify failure states.
4. "Bit-Banging" logic
For firmware engineers writing software-based drivers (bit-banging), this tool is invaluable. It breaks down the transmission bit-by-bit, showing you exactly which line of code corresponds to which voltage transition.
Step-by-Step Guide: How to Use the Simulator
Ready to visualize your data? Follow this guide to get the most out of the I2C & SPI Bus Simulation.
Phase 1: Select Your Protocol
Upon loading the tool, you will be presented with a dashboard.
- Toggle the Switch: Choose between I2C or SPI.
- The interface will update to show the relevant wires (2 wires for I2C, 4 wires for SPI).
Phase 2: Configure the Master
Before sending data, you must set the rules of the road.
- For I2C: Set the Target Slave Address (e.g.,
0x50for an EEPROM). Decide if you are performing a Write or Read operation. - For SPI: Select your Mode (0-3). This is crucial. If you don't know which mode to use, look at the datasheet of the part you are simulating.
- Mode 0: CPOL=0, CPHA=0 (Most common)
- Mode 1: CPOL=0, CPHA=1
- etc.
Phase 3: Input Data
Locate the "Data Buffer" or "Payload" field.
- Enter the data you wish to transmit. You can usually enter this as Hex (
0xFF), Binary (0b11111111), or Decimal. - Pro Tip: Try sending a mix of 0s and 1s (like
0xAAor10101010) to create a distinct square wave pattern that is easy to analyze.
Phase 4: Run the Simulation
Click "Simulate" or "Send".
- Watch the Timing Diagram area.
- Hover: Move your mouse over specific bits in the diagram. The tool will display tooltips explaining what is happening at that exact microsecond (e.g., "Master pulls SDA Low while SCL is High = START Condition").
Phase 5: Analyze and Debug
Look for the "decoder" output below the graph. It will translate the waveforms back into Hex/ASCII. If the output matches your input, your logic is sound. If you are simulating a read operation, observe how the virtual Slave drives the data line.
Why You Need This Tool (Use Cases)
Who benefits from a browser-based logic analyzer? Almost everyone in the hardware ecosystem.
1. For Students and Educators
Textbooks explain I2C with static arrows. It’s dry and confusing. This tool gamifies the learning process. It allows students to answer "What if?" questions without the risk of burning out a component. It visualizes the Start Condition, Stop Condition, and Ack bit in a way that makes the theory click instantly.
2. For Firmware Engineers
Before you write a single line of C or C++ for your STM32 or Arduino, use this tool to verify your logic.
- Scenario: You are writing an SPI driver for a new sensor. You aren't sure if data is sampled on the rising or falling edge.
- Solution: Simulate Mode 0 and Mode 1. Compare the visual output to the sensor's datasheet timing diagram. Match them up, and write your code once.
3. For Hardware Debugging
When your physical hardware isn't working, you need a "golden standard" to compare against. If your oscilloscope shows a waveform that looks different from the ideal waveform generated by this tool, you know you have a hardware issue (like excessive capacitance or missing pull-up resistors) rather than a software issue.
4. Technical Interview Prep
Embedded software interviews often ask candidates to draw timing diagrams on a whiteboard. Using this tool regularly ingrains these patterns into your visual memory, allowing you to ace questions about I2C Start conditions or SPI Chip Select timing.
Expert Tips: Getting the Most Out of the Tool
To truly leverage the power of the I2C & SPI Bus Simulation, try these advanced techniques:
- Simulate Protocol Overhead: Send one byte of data via I2C and then via SPI. Look at how many "clock cycles" it takes. You will visually see that I2C requires overhead (address bits + ACK bits), whereas SPI is a straight shot. This helps you decide which protocol to choose for high-speed data.
- The "ACK" Hunt: In I2C mode, try sending data to an address that doesn't exist in the simulation settings. Watch the NACK (Not Acknowledge) event occur. This is exactly what it looks like when your hardware is unplugged.
- Check the Edges: Zoom in on the SPI Clock edges. Verify if data is changing before the clock rises or after. This distinction is the number one cause of SPI communication bugs.
Frequently Asked Questions (FAQ)
1. Can this tool connect to my physical Arduino or Raspberry Pi?
No. This is a simulation and visualization tool. It runs entirely in your browser or software environment to demonstrate logic and timing. It does not interface with physical GPIO pins, but it generates the "perfect" waveforms you should expect to see on an oscilloscope.
2. What is the main difference between I2C and SPI visualized here?
The most obvious visual difference is the number of lines and the "handshaking." You will see I2C checking for an ACK (low pulse on SDA) after every byte. SPI will show continuous data flow as long as the CS (Chip Select) line is held low, without pausing for acknowledgement.
3. Why does the I2C waveform look "slower" or have gaps?
I2C is a half-duplex protocol. The simulation accurately shows the "turnaround" times where the Master releases the line so the Slave can pull it low (ACK). These gaps are necessary for the protocol to function, unlike the full-duplex continuous stream of SPI.
4. Is this tool accurate enough for professional driver development?
Absolutely. The logic states, transition timings, and protocol rules adhere strictly to the official Phillips (NXP) I2C specifications and Motorola SPI specifications. It is an ideal reference implementation.
Conclusion
Electronics engineering is often a battle against the invisible. The I2C & SPI Bus Simulation tool gives you a pair of "X-Ray specs" for your microcontroller's communication lines.
By visualizing the relationship between Clock, Data, and Chip Selects, you move from guessing to knowing. Whether you are a student trying to pass a digital logic exam, or a senior engineer debugging a flaky sensor driver, this tool saves you time, money, and frustration.
Don't let invisible signals stall your project.
Start Simulating Your Serial Bus Now
Click here to launch the tool and master your communication protocols today.