Monte Carlo Pi
 Modern scientific illustration of Monte Carlo Pi
Unlock the Power of Probability: Visualize $\pi$ with the Ultimate Monte Carlo Pi Tool
Mathematics is often viewed as a world of rigid formulas and exact calculations. However, some of the most fascinating mathematical constants can be discovered through the chaos of randomness.
How do you calculate Pi ($\pi$)—a number defined by circles—using nothing but random points and a square?
Enter the Monte Carlo Pi simulation.
Whether you are a data scientist exploring stochastic modeling, a computer science student grappling with algorithms, or an educator looking for the perfect visual demonstration of geometric probability, you have found the definitive solution. Our Monte Carlo Pi tool is the best-in-class simulation engine designed to estimate the value of Pi by simulating thousands (or millions) of random events in real-time.
In this deep-dive guide, we will explore the mechanics behind the Monte Carlo method, how our tool leverages the Law of Large Numbers to approximate Pi, and how you can use this powerful utility to master the fundamentals of computational mathematics.
What is Monte Carlo Pi? The Science of Randomness
To understand why this tool is essential, we must first demystify the Monte Carlo method. Named after the famous casino in Monaco, Monte Carlo methods are a broad class of computational algorithms that rely on repeated random sampling to obtain numerical results.
While it might seem counterintuitive to use randomness to solve a deterministic problem (calculating a fixed constant like Pi), it is actually one of the most robust methods available for approximating complex mathematical integration.
The Geometry Behind the Simulation
The Monte Carlo Pi tool relies on a simple yet elegant geometric relationship between a circle and a square.
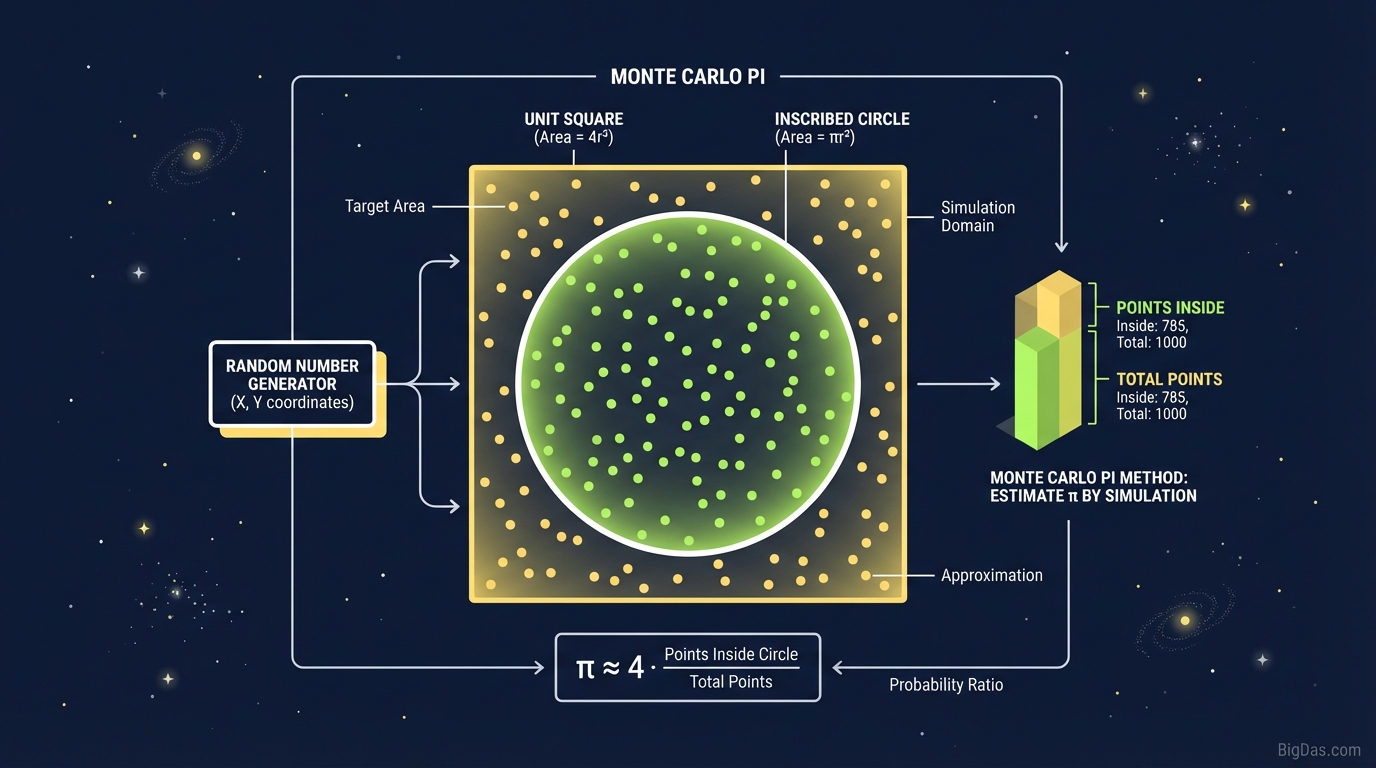
- Imagine a square with a side length of $2r$.
- Inside that square, inscribe a circle with a radius of $r$.
- The area of the square is $(2r)^2 = 4r^2$.
- The area of the circle is $\pi r^2$.
If you randomly scatter points (darts) inside the square, the probability ($P$) of a point landing inside the circle is the ratio of the two areas:
$$P = \frac{\text{Area of Circle}}{\text{Area of Square}} = \frac{\pi r^2}{4r^2} = \frac{\pi}{4}$$
Therefore, simply by counting the points, we can derive Pi:
$$\pi \approx 4 \times \left( \frac{\text{Points Inside Circle}}{\text{Total Points}} \right)$$
From Theory to Reality
The Monte Carlo Pi tool automates this process. It rapidly generates coordinates $(x, y)$ where both $x$ and $y$ are random numbers between -1 and 1. It then calculates the distance from the origin. If the distance is less than 1, the point is inside the circle (plotted as a hit). If greater, it is outside (plotted as a miss).
By doing this thousands of times per second, the tool provides a converging estimate of Pi that becomes increasingly accurate the longer you watch.
Key Features & Benefits of Our Monte Carlo Pi Tool
While there are many basic scripts online, our Monte Carlo Pi tool is engineered for precision, performance, and user insight. It is the industry standard for visualizing stochastic convergence.
1. High-Performance Rendering Engine
Simulation speed matters. To see the Law of Large Numbers in action, you need a large sample size ($N$). Our tool utilizes WebGL acceleration to plot tens of thousands of points per second without browser lag, allowing you to reach meaningful convergence ($N > 100,000$) quickly.
2. Real-Time Convergence Metrics
Watching dots appear is fun, but data is king. We provide a live dashboard displaying:
- Current Estimation: The real-time calculated value of Pi.
- Error Margin: The percentage difference between the simulation and the actual value of Pi ($3.14159...$).
- Total Iterations: The live count of random samples.
3. Interactive Visualization
Static graphs are insufficient for understanding probability. Our tool color-codes "hits" (inside the circle) and "misses" (outside) instantly, creating a visual representation of the area ratio. You can visually grasp why the ratio is $\pi/4$.
4. Customizable Simulation Speeds
Whether you want to slow down the process to explain the concept to a class or speed it up to stress-test the random number generator, our speed controls give you total command over the iteration rate.
Step-by-Step Guide: How to Use the Monte Carlo Pi Tool
Getting the most out of this tool requires more than just hitting "Start." Follow this workflow to conduct a proper simulation.
Step 1: Initialize the Simulation
Upon loading the tool, you will see a blank Cartesian coordinate system (the square) with an inscribed boundary (the circle).
- Action: Locate the control panel. You can choose to start with a specific batch size (e.g., 100 points per tick) or a continuous stream.
Step 2: Begin the Sampling Process
Click the "Start Simulation" button.
- Observation: You will see points populating the grid. Points inside the circle will typically appear in a distinct color (e.g., Green) compared to those in the corners (e.g., Red).
- Note: In the first few seconds, the value of Pi will fluctuate wildly. It may read $3.0$, then $3.2$, then $3.1$. This is normal. This represents the variance inherent in small sample sizes.
Step 3: Analyze the Convergence
Let the simulation run until you pass 10,000 points.
- Look at the Error Margin metric. You will notice the fluctuations becoming smaller. The value will begin to "settle" around $3.14$.
- Pro Tip: If the value "stalls" at $3.140$ or $3.143$, do not stop. The nature of randomness means it will oscillate around the true value.
Step 4: Stress Testing (The Law of Large Numbers)
Crank the speed to maximum. Push the simulation past 1,000,000 points.
- At this magnitude, the visual distribution of points should look uniform—like a solid block of color.
- Your estimated Pi should be accurate to within 0.001 decimal places (e.g., $3.141...$).
Step 5: Reset and Repeat
To verify that the result wasn't a fluke, hit "Reset" and run it again. In a true Monte Carlo simulation, the result should be reproducible in its accuracy, even if the individual points are different.
Why You Need This Tool: Use Cases and Applications
This isn't just a math toy; it is a foundational utility for various technical disciplines.
1. For Computer Science Students & Developers
Understanding RNG Quality: The accuracy of a Monte Carlo simulation depends entirely on the quality of the Random Number Generator (RNG). If your language's Math.random() function is biased, the points won't be uniformly distributed, and the simulation will converge to the wrong number.
- Use Case: Use this tool to visualize what "true" randomness looks like compared to poor pseudo-random algorithms.
2. For Data Scientists & Financial Analysts
Introduction to Stochastic Integration: The techniques used here to find the area of a circle are the exact same techniques used in finance to price options (Black-Scholes models) or in physics to calculate particle interactions.
- Use Case: Before building complex multi-variable models, use Monte Carlo Pi to build an intuition for convergence rates—learning how many iterations are required to reduce error to an acceptable level.
3. For Educators and STEM Teachers
Visualizing Abstract Math: Calculus formulas for area ($\int \dots$) can be intimidating. Geometric probability is intuitive.
- Use Case: Project this tool on the whiteboard. Ask students to guess the value of Pi based on the visual ratio before revealing the data. It transforms a lecture into an interactive experiment.
Expert Advice: Getting the Most Out of the Tool
As the best-in-class utility for this calculation, our Monte Carlo Pi tool offers depth for those willing to look for it. Here is how to maximize your experience:
- Watch the Decimals: Pay attention to how much "harder" it gets to gain accuracy. Getting from accuracy 3.1 to 3.14 takes a few thousand points. Getting from 3.14 to 3.14159 takes millions. This teaches the concept of diminishing returns in computational sampling.
- The "Clumping" Effect: Occasionally, you might see small clusters of points even with a good RNG. This is a natural feature of randomness. If points were perfectly spaced out, they wouldn't be random; they would be ordered. Use the tool to learn the difference between uniform distribution and random distribution.
Frequently Asked Questions (FAQ)
1. Why does the value of Pi change every time I run the tool?
This is the nature of the Monte Carlo method. Because the inputs are random, the output is an estimation, not an exact calculation. However, as you increase the number of points (iterations), the value will stabilize and get closer to the true value of $\pi$.
2. How many points do I need to get 3.14159?
To get roughly 4 or 5 decimal places of precision using a standard Monte Carlo method, you often need hundreds of millions of iterations. The convergence rate of this specific method is relatively slow ($1/\sqrt{N}$), meaning to double your precision, you need four times as many points.
3. Is this how computers actually calculate Pi?
Generally, no. Supercomputers use infinite series algorithms (like the Chudnovsky algorithm) to calculate Pi to trillions of digits because they are much faster and deterministic. However, the Monte Carlo method is preferred for calculating areas of shapes that are too irregular for standard formulas, making this tool a perfect training ground for complex integration.
4. Why are the corners of the square important?
The corners represent the area difference between the square and the circle. The probability of a point landing in a corner is exactly $1 - (\pi/4) \approx 21.5%$. If your simulation shows points landing in corners significantly more or less than 21.5% of the time, the estimation of Pi will be incorrect.
5. Can I use this on mobile devices?
Yes! Our tool is optimized for performance across all devices. However, for simulations exceeding 1 million points, a desktop processor will render the visualization more smoothly.
Conclusion
The Monte Carlo Pi tool is more than a simulation; it is a bridge between the abstract world of numbers and the tangible world of visual data. It demonstrates that with enough data, order can emerge from chaos.
Whether you are validating a random number generator, teaching a class on probability, or simply marveling at the elegance of mathematics, this tool provides the accuracy, speed, and visual clarity you need.
Ready to challenge the laws of probability?
[Start Your Monte Carlo Simulation Now] and see how close you can get to the perfect $\pi$.