PWM Signal Generator
 Modern scientific illustration of PWM Signal Generator
Master Pulse-Width Modulation: The Ultimate Online PWM Signal Generator Tool
In the world of electronics, robotics, and embedded systems, precision is everything. Whether you are dimming an LED, controlling the speed of a DC motor, or driving a servo, the method of control almost always comes down to one fundamental concept: Pulse-Width Modulation (PWM).
However, understanding the mathematical relationship between frequency, duty cycle, and the resulting waveform can be abstract and difficult to visualize. Mental calculations often lead to errors, and setting up an oscilloscope just to check a theoretical waveform is time-consuming.
Enter our Best-in-Class PWM Signal Generator.
This tool is not just a simulator; it is a high-precision digital environment that allows engineers, hobbyists, and students to visualize and control PWM signals in real-time. This guide will walk you through the intricacies of PWM, how to leverage our tool for your projects, and why this specific generator is the essential utility you need in your digital toolbox.
What is a PWM Signal Generator?
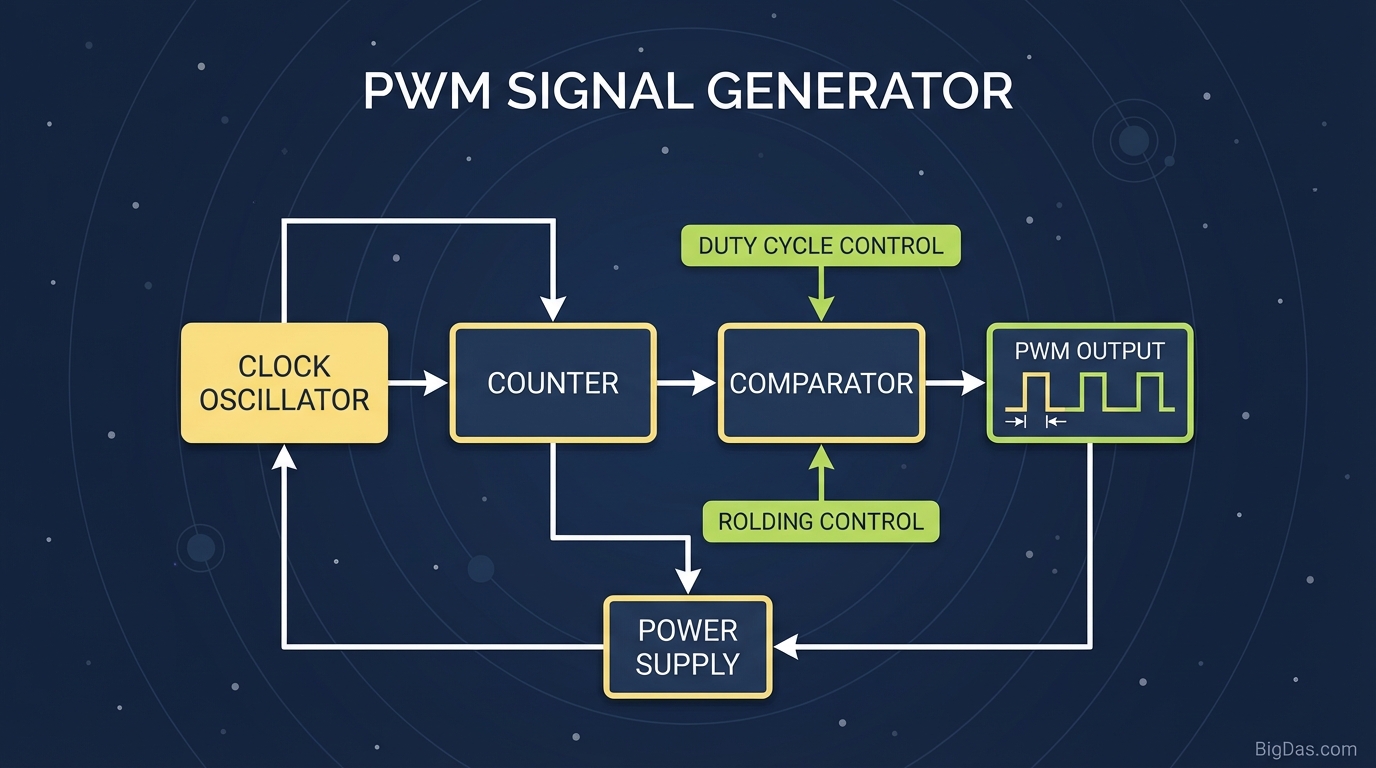
To understand the tool, we must first master the concept. Pulse-Width Modulation (PWM) is a modulation technique used to encode a message into a pulsing signal. Although this is a digital signal (switching between fully ON and fully OFF), it is used to simulate an analog output.
A PWM Signal Generator creates this waveform based on specific user inputs. It allows you to manipulate the signal's properties to see how they affect the electrical output.
The Anatomy of the PWM Waveform
Our tool helps you visualize the two critical components of PWM:
- Duty Cycle: This implies the percentage of one period in which a signal is active (High).
- 0% Duty Cycle: The signal is always off (0V).
- 50% Duty Cycle: The signal is on half the time and off half the time (Perfect Square Wave).
- 100% Duty Cycle: The signal is always on (Max Voltage).
- Frequency: Measured in Hertz (Hz), this determines how fast the PWM completes a cycle (one ON and one OFF state).
- A higher frequency means the switching happens so fast that the load (like a motor or LED) only "sees" the average voltage, resulting in smooth operation.
The "Average Voltage" Concept
The magic of our PWM Signal Generator is its ability to demonstrate the Average Voltage ($V_{avg}$).
$$V_{avg} = V_{in} \times \text{Duty Cycle}$$
By adjusting the sliders on our tool, you can instantly see how changing the duty cycle affects the effective voltage delivered to your component, bridging the gap between digital theory and physical reality.
Key Features & Benefits
Why is this the best PWM tool on the web? We have stripped away the clunky interfaces of legacy engineering software and built a sleek, responsive, and mathematically rigorous engine.
1. Real-Time Waveform Visualization
Static images in textbooks cannot convey the dynamic nature of signal processing. As you adjust the parameters in our tool, the graph updates instantaneously. You can literally watch the pulse width expand and contract, giving you an intuitive grasp of the signal's behavior.
2. High-Precision Frequency Control
Whether you are working with low-frequency servo controls (typically 50Hz) or high-frequency switching power supplies (in the kHz or MHz range), our generator allows for granular adjustments. This ensures that what you simulate matches what you intend to code into your microcontroller (e.g., Arduino, ESP32, or STM32).
3. Accurate Duty Cycle Calculation
Our tool allows for floating-point precision on duty cycle percentages. This is crucial for applications requiring fine-tuned control, such as RGB lighting color mixing or precise PID motor control loops.
4. Zero-Hardware Prototyping
Before you risk burning out a MOSFET or driving a motor too hard, you can simulate the signal here. It is a safe sandbox to verify your math before applying power to physical hardware.
Step-by-Step Guide: How to Use the PWM Signal Generator
Getting the most out of this tool is simple. Follow this workflow to simulate your signals effectively.
Step 1: Define Your Goal
Are you simulating a dimmed LED or a servo motor?
- For LEDs/Motors: You are generally looking for "Effective Voltage."
- For Servos/Communication: You are looking for specific pulse lengths.
Step 2: Set the Frequency
Use the Frequency input to set your speed.
- Standard visualization: Start at 1 Hz to 5 Hz. This is slow enough to see the "On" and "Off" states clearly with the naked eye.
- Simulation mode: Crank it up to 1 kHz or higher to see how the waveform densities change.
Step 3: Adjust the Duty Cycle
Move the Duty Cycle slider from 0% to 100%.
- Observe the graph. Note how the "High" section of the square wave widens as the percentage increases.
- If you set it to 25%, you will see the signal stays "Low" for three-quarters of the cycle.
Step 4: Analyze the Output
Look at the calculated data points provided by the tool.
- Period ($T$): The tool calculates the time for one cycle ($T = 1/f$).
- Pulse Width: The actual time duration the signal remains High ($T \times \text{Duty Cycle}$).
Why You Need This Tool: Top Use Cases
This PWM Signal Generator isn't just for students; it is a vital utility for professionals across several industries.
1. Embedded Systems Development
If you are coding firmware for an Arduino or PIC microcontroller, you need to configure hardware timers. Using this tool, you can visualize the relationship between your timer interrupts and the resulting waveform, ensuring your prescalers and compare-match registers are calculated correctly.
2. Motor Control (Robotics)
DC motors are controlled via PWM. However, if the frequency is too low, the motor will "hum" or vibrate. If it is too high, the switching transistors may overheat. This tool helps you visualize the trade-off and select the optimal frequency and duty cycle for smooth torque control.
3. LED Lighting and Dimming
Unlike incandescent bulbs, LEDs cannot be dimmed by simply lowering the voltage (they are current-driven devices). They must be flashed on and off rapidly. This tool demonstrates how a 20% duty cycle creates the illusion of a dim light to the human eye, without changing the actual current driving the LED.
4. Audio Synthesis
In audio electronics, a square wave is a fundamental waveform. By modulating the pulse width (Pulse Width Modulation), you can change the timbre of the sound. Synthesizer enthusiasts use this visualization to understand how duty cycle changes affect the harmonic content of a sound wave.
5. Switch Mode Power Supplies (SMPS)
Engineers designing Buck or Boost converters rely on PWM to regulate output voltage. This tool is excellent for visualizing the fundamental switching concept behind voltage regulation before moving to complex SPICE simulations.
Pro-Tips: Getting the Most Out of the Tool
To truly leverage the power of this generator, keep these technical insights in mind:
- Period vs. Frequency: Always remember the inverse relationship. If you are struggling to understand why your servo isn't moving, check the Period calculation. A servo typically expects a pulse every 20ms (50Hz). If your frequency is set to 1kHz, the period is too short (1ms), and the servo won't react.
- The Resolution Factor: In the real world, digital PWM has a "resolution" (e.g., 8-bit, 10-bit). While our tool provides ideal mathematical precision, remember that an 8-bit microcontroller only has 256 steps of duty cycle (0-255). Use this tool to find the ideal percentage, then map it to your hardware's bit-depth.
- Visualizing Inertia: When looking at the graph, imagine the "High" state as a push and the "Low" state as a rest. For a motor, the physical inertia "smooths" these pushes into continuous motion. The higher the frequency, the smoother the motion.
Frequently Asked Questions (FAQ)
1. Can this tool replace an oscilloscope?
No, and it isn't meant to. An oscilloscope measures actual electrical signals from hardware. This tool is a generator and simulator used for planning, calculating, and visualizing theoretical signals before you build the circuit. It is a design tool, not a diagnostic tool.
2. Why does the frequency matter if I only care about dimming a light?
If the frequency is too low (e.g., below 100Hz), the human eye will detect the flickering of the LED, which can cause headaches or visual artifacts (stroboscopic effect). You need a frequency high enough to trick the eye, but the Duty Cycle determines the brightness.
3. What is the difference between Analog Output and PWM?
True Analog Output (via a DAC) provides a steady, continuous voltage (e.g., a steady 2.5V). PWM provides a rapid stream of 0V and 5V pulses that average out to 2.5V. While they often achieve similar results (like motor speed), the physics are different. This tool visualizes the digital pulse nature of PWM.
4. Is a 50% Duty Cycle the same as an AC sine wave?
No. A 50% Duty Cycle PWM signal is a square wave. It switches instantly between high and low. An AC sine wave curves gradually. However, filtered PWM signals can be used to approximate sine waves in inverters.
Conclusion
Pulse-Width Modulation is the heartbeat of modern electronics control. Whether you are automating a smart home, building a combat robot, or designing a synthesizer, the ability to control and understand these signals is paramount.
Don't rely on guesswork or complex mental math. Visualizing your signal is the first step toward building flawless hardware.
Ready to see the math in action?