Sensor Data Simulation
 Modern scientific illustration of Sensor Data Simulation
Master IoT Prototyping: The Ultimate Guide to Sensor Data Simulation
In the fast-paced world of Internet of Things (IoT) development and embedded systems, time is the scarcest resource. Hardware dependencies are often the biggest bottleneck. You have the dashboard ready, the backend logic is sound, and your machine learning models are prepped—but you are stuck waiting for the physical sensors to arrive, or worse, spending hours wiring breadboards just to generate a few lines of CSV data.
This is the "Hardware Gap," and it kills project momentum.
Enter the Sensor Data Simulation tool. Whether you are a seasoned IoT architect, a data scientist training anomaly detection models, or a student learning the ropes of electronics, the ability to generate and visualize realistic data streams without physical hardware is a superpower.
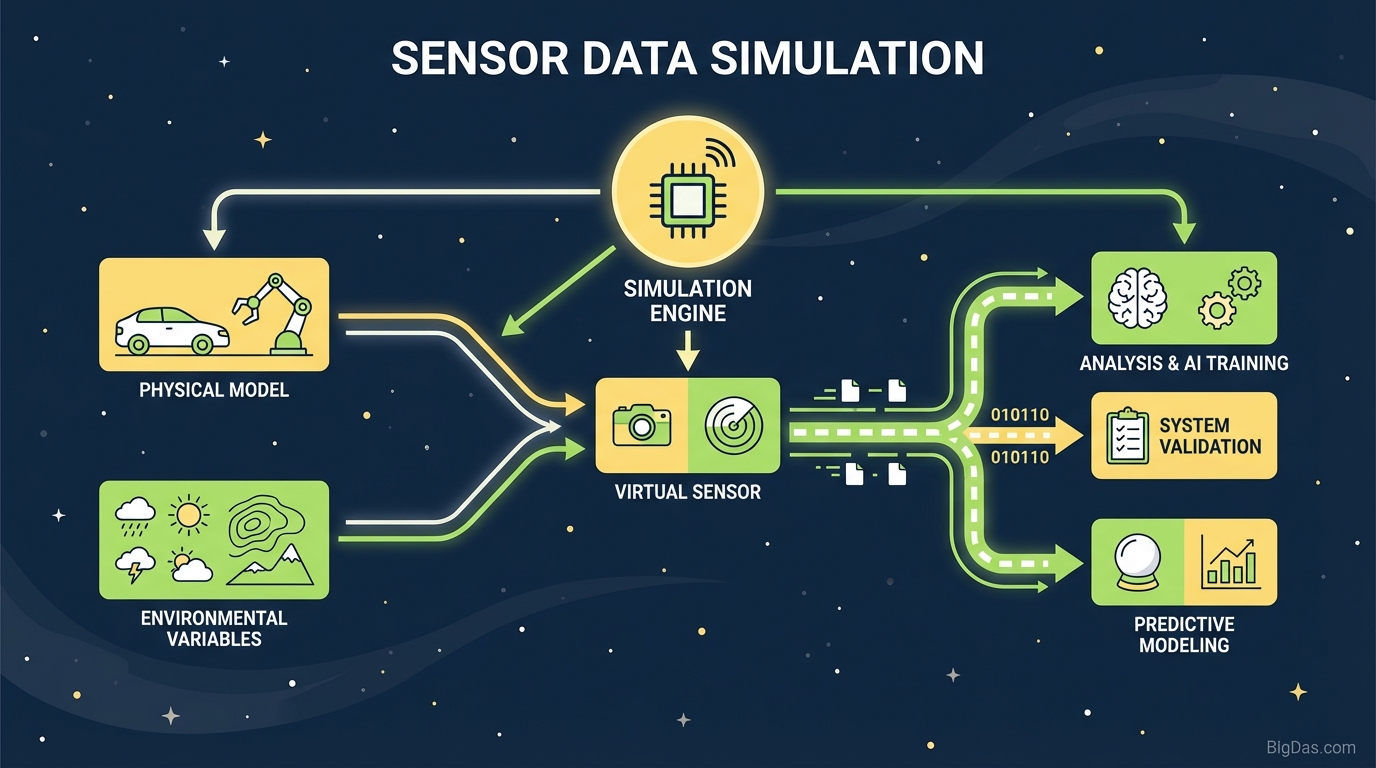
In this deep dive, we will explore why our best-in-class Sensor Data Simulation tool is the missing link in your development stack, how it mimics complex physical phenomena like Temperature, LDR (Light), and Ultrasonic waves, and how you can leverage it to ship better products faster.
What is Sensor Data Simulation?
At its core, Sensor Data Simulation is the process of using software algorithms to mimic the behavior and output of physical electronic sensors. However, calling it a "random number generator" would be a massive understatement.
High-quality simulation does not just spit out integers; it replicates the physics of the environment.
Real-world sensor data is rarely clean. It has noise, drift, jitter, and outliers. A temperature sensor in an industrial boiler behaves differently than one in a smart fridge. An Ultrasonic sensor (like the HC-SR04) has specific range limitations and reflection issues. An LDR (Light Dependent Resistor) reacts non-linearly to light intensity changes.
Our Sensor Data Simulation tool bridges the gap between theoretical code and physical reality. It generates data streams that respect:
- Range constraints: (e.g., An ultrasonic sensor cannot read negative distance).
- Temporal consistency: (e.g., Temperature usually doesn't jump from 20°C to 100°C in one millisecond without cause).
- Environmental Noise: The slight variations found in all electronic components.
By using this tool, you decouple your software development from hardware limitations, allowing you to test edge cases that are difficult or dangerous to recreate in the real world.
Key Features & Benefits
Why is this specific tool considered the industry standard for virtual sensor data? It comes down to the balance between ease of use and mathematical depth.
1. Multi-Sensor Support
The tool provides distinct algorithms for the most common sensor types used in IoT and robotics:
- Temperature Sensors: Simulates thermal dynamics suitable for HVAC systems, environmental monitoring, or industrial machinery.
- LDR (Light Dependent Resistor): Simulates lux levels and resistance changes based on ambient light, perfect for testing day/night cycles or automated lighting systems.
- Ultrasonic Sensors: Simulates distance and proximity data, crucial for robotics obstacle avoidance and tank level monitoring.
2. Realistic Noise Injection
Perfect data is useless for testing. If your code only works with a straight line, it will fail in the field. This tool allows you to inject Gaussian noise and random anomalies into the stream. This forces your sorting algorithms, filters (like Kalman filters), and alert systems to work for their money.
3. Real-Time Visualization
Raw numbers are hard to interpret. The tool includes a dynamic, real-time charting engine. You can watch the "temperature" rise or the "distance" shrink visually. This instant feedback loop helps you spot patterns and verify your configuration instantly.
4. Customizable Parameters
You aren’t locked into presets. You have full control over:
- Frequency: How often data is generated (Simulate 1Hz vs 100Hz).
- Min/Max Boundaries: Set the operating limits of your virtual hardware.
- Trend Direction: Force the data to trend upwards, downwards, or oscillate (Sine wave).
5. Export Capabilities
Once you have generated a dataset that represents a specific scenario (e.g., a machine overheating), you can export the data for external use in Python, MATLAB, Excel, or direct ingestion into your SQL database.
Step-by-Step Guide: How to Use the Tool
Ready to generate your first stream? Follow this guide to simulate a realistic Temperature Sensor scenario.
Step 1: Select Your Sensor Type
Navigate to the dashboard and select "Temperature" from the sensor dropdown menu. You will see the interface shift to reflect thermal parameters (degrees Celsius/Fahrenheit).
Step 2: Define Your Baseline and Range
Set your context.
- Minimum Value: 20 (Room temperature).
- Maximum Value: 80 (Overheating threshold).
- Base Value: Start at 25.
Step 3: Configure Behavior (The Secret Sauce)
This is where you make it real.
- Trend: Select "Oscillate" to mimic a thermostat controlling a heater (rising and falling).
- Volatility/Noise: Set this to
Lowfor a stable room orHighfor a sensitive sensor in a turbulent environment.
Step 4: Generate and Visualize
Click "Start Simulation." The graph will immediately begin plotting points. Watch how the line moves. Does it look organic? If it’s too jagged, reduce the noise. If it’s too flat, increase the variance.
Step 5: Integration
Copy the generated JSON or CSV stream. You can now paste this directly into your application’s input stream or save it as a file to test your backend’s data parsing logic.
Why You Need This Tool: Critical Use Cases
Who benefits most from virtualizing their sensor inputs?
1. IoT Developers & Firmware Engineers
When developing firmware for an ESP32 or Arduino, you often need to code logic like: "If Temp > 50, turn on Fan." Testing this physically requires you to heat up a sensor with a hair dryer or lighter repeatedly. With Sensor Data Simulation, you simply drag a slider or script a spike to 51°C. It saves hours of manual manipulation and ensures your logic triggers correctly every single time.
2. Data Scientists & ML Engineers
Training a machine learning model to predict equipment failure (Predictive Maintenance) requires massive datasets containing "failure" states. However, real machines rarely fail. You can use this tool to generate thousands of hours of "normal" operation data and inject specific "failure" patterns. This synthetic data is invaluable for training robust models without waiting for a real-world disaster.
3. QA and Stress Testing
How does your cloud dashboard handle 10,000 incoming data points per second? It is expensive to buy 10,000 physical sensors. It is free to spawn 10,000 instances of our simulation tool. Use it to flood-test your MQTT brokers and API endpoints to ensure scalability.
4. UI/UX Designers
Building a dashboard for a Smart Home app? You need live data to design the charts and gauges effectively. Instead of using static placeholders, plug in the simulator. You can see exactly how your UI responds to rapid changes, ensuring your animations and color-coding (e.g., turning red when hot) look perfect.
Expert Advice: Getting the Most Out of the Tool
To truly leverage the power of this simulation, you need to think beyond "normal" operation. Here are three pro-tips for maximizing value:
- Simulate Hardware Failure: Don't just simulate temperature changes; simulate the sensor breaking. configure the tool to drop the signal to
0ornullrandomly. Does your app crash? Or does it display a "Sensor Error" message? This is how you build bulletproof software. - Test the "Jitter": In Ultrasonic sensors, surfaces often deflect sound waves, causing momentary incorrect readings. Use the high-noise setting to verify that your code implements a Running Average or Median Filter to smooth out the data. If the raw simulation breaks your logic, the real world definitely will.
- Boundary Testing: What happens at the exact limit of the sensor? If an LDR sensor reads max brightness (1023 on a 10-bit ADC), does your database handle the integer correctly? Use the tool to peg the values at the absolute minimum and maximum to check for overflow errors.
Frequently Asked Questions (FAQ)
Q1: Can this tool simulate connection latency? While the tool primarily focuses on data payload generation, you can manually stagger the generation timestamps to simulate network lag or packet loss, helping you test how your application handles out-of-order data.
Q2: Is the Ultrasonic simulation accurate to real physics? The simulation uses mathematical models based on standard time-of-flight characteristics. While it doesn't calculate 3D spatial acoustics, it accurately represents the data stream you would receive from a microcontroller reading an HC-SR04 or similar module, including signal variance.
Q3: Can I use this data for commercial Machine Learning models? Absolutely. Synthetic data is a standard practice in AI development. By augmenting your small real-world dataset with large volumes of simulated data from this tool, you can improve model generalization and robustness.
Q4: What is the difference between the LDR and Temperature algorithms? Temperature tends to have high thermal mass (changes slowly), whereas light (LDR) changes instantaneously. Our algorithms reflect this. The Temperature simulation resists rapid jumps (unless configured for spikes), while the LDR simulation allows for instant state changes, mimicking a light switch being flipped.
Conclusion
The gap between software logic and hardware reality is where most IoT projects fail or face massive delays. Relying solely on physical testing is slow, expensive, and limits your ability to test edge cases.
Sensor Data Simulation is not just a convenience; it is a strategic asset. It allows you to validate your architecture, train your models, and stress-test your code before a single circuit board is printed.
Don't wait for the hardware to arrive. Take control of your data streams today.