UART Communication Demo
 Modern scientific illustration of UART Communication Demo
Master Serial Protocols: The Ultimate Interactive UART Communication Demo
In the world of embedded systems and digital electronics, invisible data streams are the norm. You write code, you wire up a microcontroller, and you pray that the bits flying across the wire land in the right order. But when things go wrong—when garbage characters appear in your terminal or communication simply hangs—debugging can feel like searching for a needle in a haystack without a magnet.
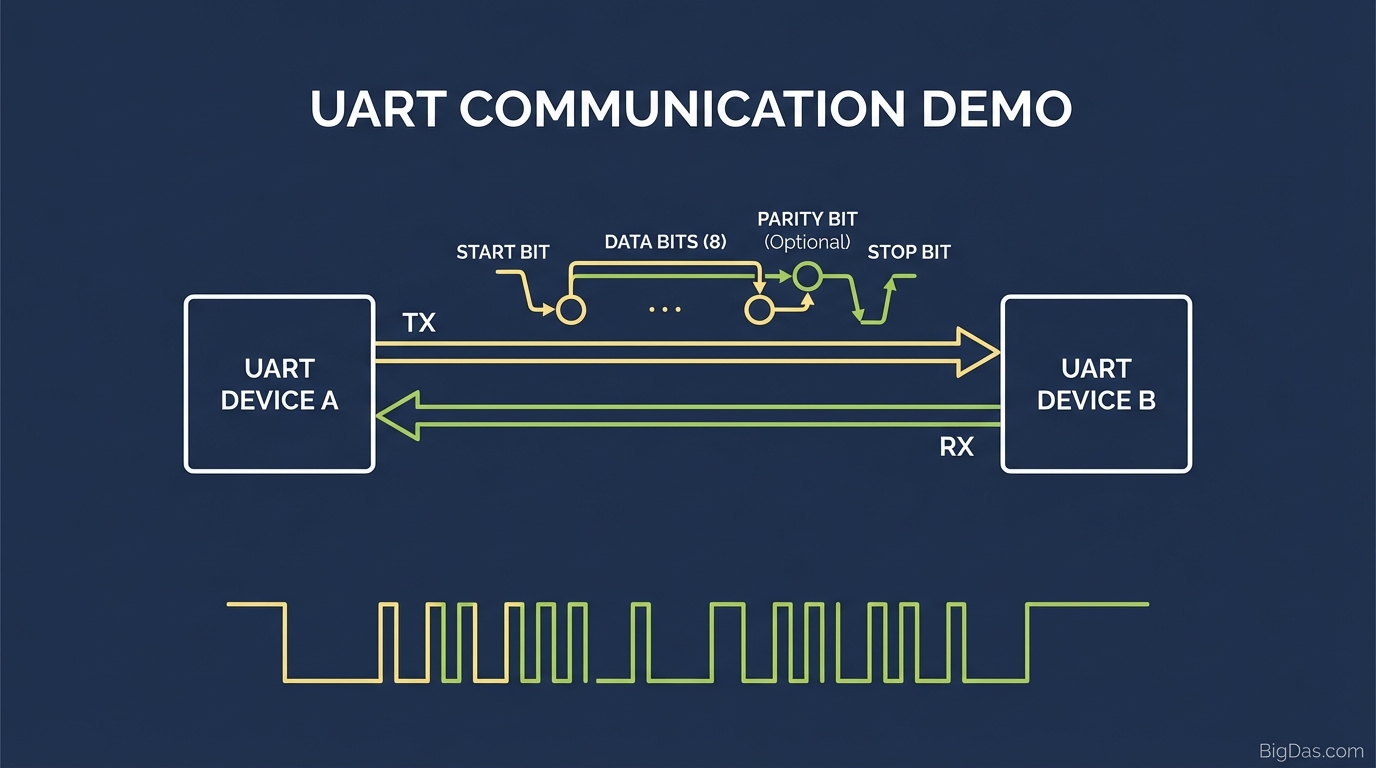
Universal Asynchronous Receiver-Transmitter (UART) is the backbone of serial communication. It is ubiquitous, reliable, and fundamentally simple. Yet, for students, hobbyists, and even seasoned engineers, visualizing exactly how a specific character translates into a stream of high and low voltage pulses can be abstract.
Enter our UART Communication Demo.
This isn't just a static diagram; it is the best-in-class, interactive visualization tool designed to demystify serial transmission. Whether you are debugging a driver, learning the protocol for the first time, or teaching a class, this tool provides the "X-Ray vision" you need to understand UART at the bit level.
What is the UART Communication Demo?
The UART Communication Demo is a sophisticated, browser-based simulation tool that visualizes the transmission of a character via the UART protocol in real-time.
To understand the tool, we must first briefly address the protocol. UART is asynchronous, meaning there is no shared clock signal between the transmitter (TX) and the receiver (RX). Instead, both sides agree on a timing speed (Baud Rate) and a frame format.
This tool bridges the gap between the ASCII character you send and the electrical waveform that travels down the wire. It breaks down the transmission into its core components:
- Idle State (High Voltage)
- Start Bit (Pull to Low)
- Data Bits (LSB First)
- Parity Bit (Optional error checking)
- Stop Bit (Return to High)
By rendering this process step-by-step, the tool transforms abstract binary concepts into concrete visual logic.
Key Features & Benefits
Why is this specific UART Communication Demo superior to static timing diagrams found in textbooks? Here is what makes it the industry standard for learning and debugging:
1. Pixel-Perfect Waveform Visualization
The tool renders an accurate digital logic waveform. You can see the logic High (1 / VCC) and logic Low (0 / GND) states clearly. This helps users visualize the "Idle High" standard of UART lines and the crucial falling edge of the Start Bit.
2. Real-Time Bit Transmission
Unlike a static image, our demo animates the transmission. You watch the bits shift out one by one. This emphasizes the concept of time-division multiplexing—showing that data isn't sent instantly, but sequentially based on the Baud rate.
3. Customizable Data Parameters
UART isn't "one size fits all." This tool allows you to configure the frame just like you would in firmware registers:
- Data Bits: Toggle between 7 or 8 bits.
- Parity: Visualize None, Even, or Odd parity calculations instantly.
- Stop Bits: Adjust between 1 or 2 stop bits.
4. ASCII to Binary to Waveform Conversion
Type in a letter (e.g., 'A'), and the tool instantly calculates the ASCII hex code (0x41), converts it to binary (01000001), and maps it to the Least Significant Bit (LSB) first transmission order.
Step-by-Step Guide: How to Use the Tool
Ready to see your data in motion? Follow this guide to master the UART Communication Demo.
Step 1: Configure Your Protocol
Before transmitting, set your "virtual hardware" parameters on the control panel.
- Select Character: Enter the alphanumeric character you wish to send (e.g., "k").
- Parity Setting: Choose "None" for standard transmission, or experiment with "Even/Odd" to see how the extra bit is calculated.
Step 2: Initiate Transmission
Click the "Transmit" button.
Step 3: Observe the "Idle" to "Active" Transition
Watch closely. The line will start at a Logic High (1). As soon as transmission begins, the line drops to Logic Low (0). This is the Start Bit. It wakes up the receiver and synchronizes the internal clocks.
Step 4: Analyze the Data Stream
The tool will highlight each bit as it passes "over the wire."
- Notice the order: Least Significant Bit (LSB) is sent first (Bit 0), ending with the Most Significant Bit (MSB) (Bit 7).
- Pro Tip: Pause and match the waveform High/Low states to the binary representation displayed below the graph.
Step 5: The Stop Bit Return
Once the data and parity bits are sent, watch the line pull back up to Logic High. This is the Stop Bit, ensuring the line returns to the Idle state, ready for the next byte.
Why You Need This Tool: Top Use Cases
This tool isn't just a novelty; it is a vital utility for several scenarios.
1. For Students and Educators
Textbooks describe UART dryly. This demo brings it to life. Professors use this tool to demonstrate framing errors and parity generation visually in the classroom. It dramatically reduces the learning curve for students struggling with the concept of LSB-first transmission.
2. For Firmware Developers (Debugging)
Writing a "Bit-Banging" UART driver on a GPIO pin? You need to know exactly how your waveform should look before you hook up an oscilloscope. Use this tool to generate a "reference waveform" for a specific character (including parity), then compare it against what you see on your logic analyzer.
3. For Hardware Hackers
Reverse engineering a mysterious port on a router or IoT device? By simulating different UART configurations (like 7E1 vs 8N1) in this tool, you can visualize what the raw binary coming off your logic analyzer should look like, helping you decode proprietary streams faster.
Expert Advice: How to Get the Most Out of This Tool
To truly master UART, do not just watch the animation passively. Use the tool to run these specific experiments:
- The "All Zeros" Test: Transmit the Null character (0x00). Watch how the line goes Low for the Start bit, stays Low for 8 data bits, and only pops up for the Stop bit. This mimics a "Break" condition if held too long.
- The Parity Check: Toggle between 'A' (Binary 01000001) using Even vs. Odd parity. Watch how the tool automatically flips the parity bit High or Low to satisfy the count. This clarifies exactly how hardware error checking works.
- The Alternating Pattern: Transmit the character 'U' (0x55, Binary 01010101). This creates a perfect square wave frequency. It is the industry standard for measuring Baud rate accuracy with an oscilloscope. Use the tool to visualize why 'U' is the magic character for calibration.
Frequently Asked Questions (FAQ)
1. Why is the UART line "High" when idle?
In UART (and RS-232 logic), the idle state is kept at Logic High (Mark) to distinguish an idle line from a broken or disconnected wire. If the wire is cut, the voltage floats or drops to zero, which the receiver can detect as a fault. Our tool visualizes this explicitly by starting the animation at the top of the graph.
2. Does this tool show RS-232 voltages or TTL/CMOS?
This demo visualizes TTL/CMOS Logic levels (0V to 3.3V/5V), which is what you encounter directly at the microcontroller pins (Arduino, STM32, ESP32). RS-232 uses negative/positive voltages (-12V to +12V) which are inverted, but the timing logic displayed here remains identical.
3. Why is the LSB (Least Significant Bit) sent first?
This is a historical standard of the UART protocol. Sending LSB first allows the receiver to begin processing the value (and shifting it into a register) before the entire byte has arrived. The tool visualizes the binary number "backwards" compared to how you write it on paper, accurately reflecting this transmission standard.
4. What happens if the Baud rates don't match?
While this tool assumes perfect synchronization, in the real world, a baud rate mismatch results in the receiver sampling the voltage at the wrong time (reading a 0 as a 1). Use this tool to see where the center of each bit should be, so you understand why timing drift causes errors.
Conclusion
Understanding the UART protocol is a rite of passage for every electronics engineer and developer. While the concept is simple, the implementation involves precise timing and bit manipulation.
The UART Communication Demo removes the guesswork. It provides a highly accurate, visual reference that bridges the gap between code and electricity. Whether you are debugging a complex embedded system or simply trying to understand how a keyboard talks to a computer, this tool is your definitive guide.
Ready to see your data travel? scroll up, input your character, and watch the pulse of digital communication come to life.