Percentage Difference Calculator
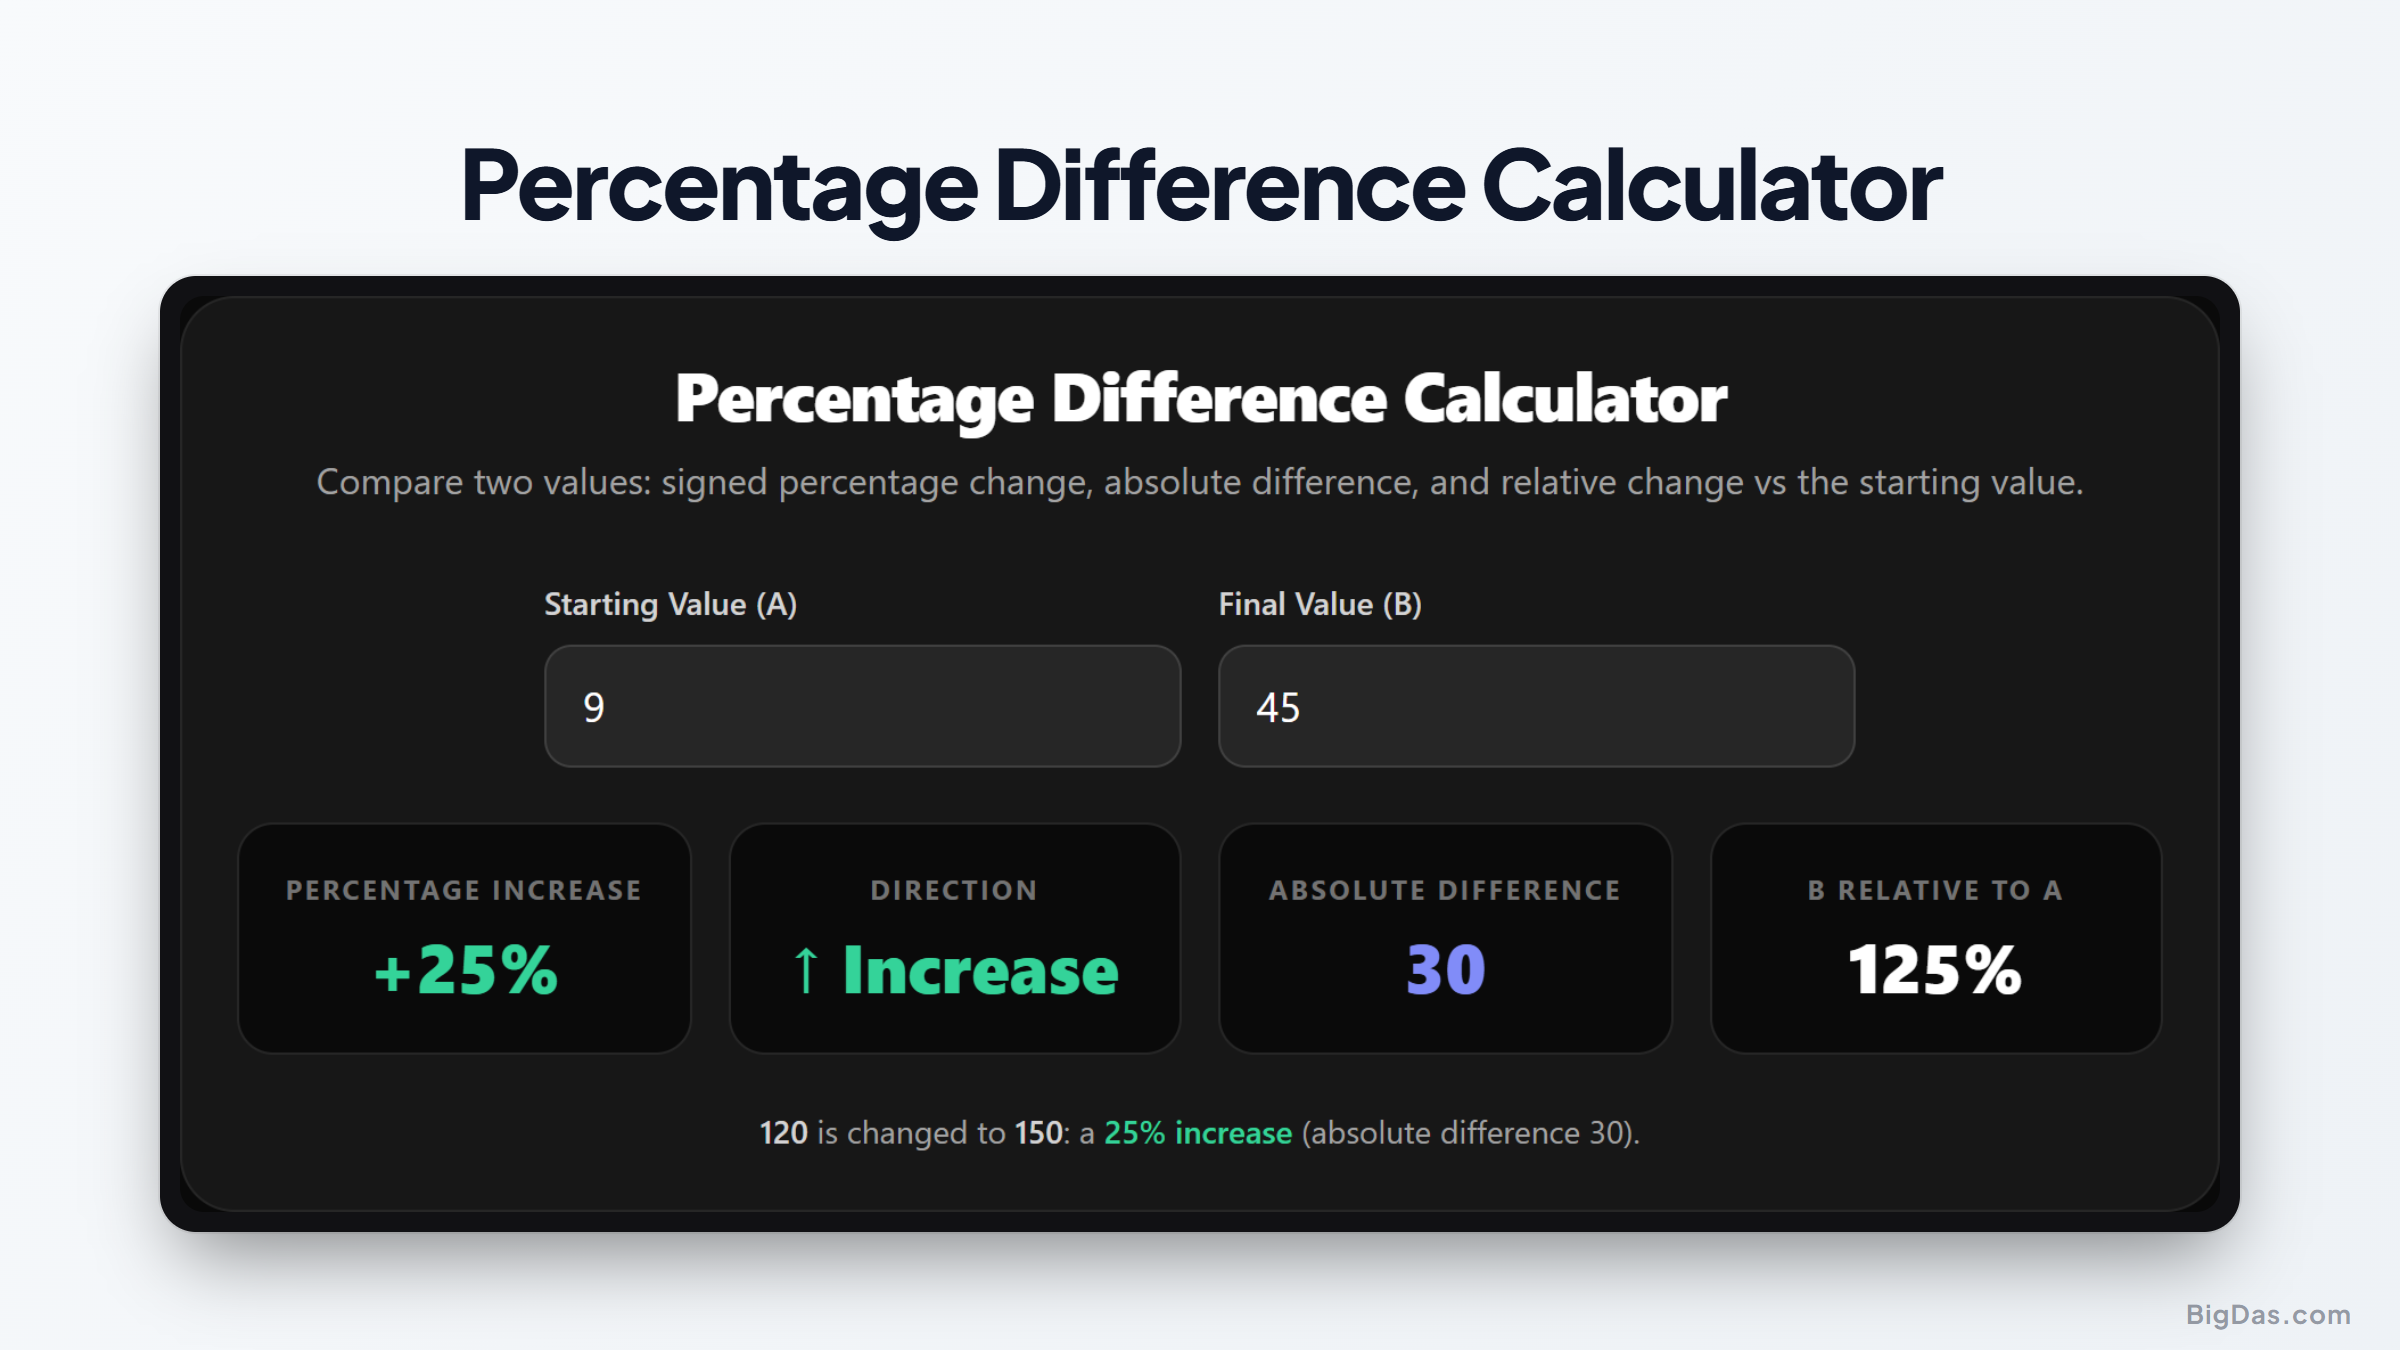
 Generated infographic and interface snapshot for Percentage Difference Calculator
Percentage Difference Calculator: Compare Values, Relative Change, and Percent Shift
Working with numerical comparisons is a daily requirement for analysts, students, marketers, and business owners. Whether tracking quarterly revenue, analyzing market trends, or comparing scientific measurements, understanding how numbers shift relative to one another is essential. However, calculating these metrics manually often creates confusion. People frequently mix up percentage difference with percent change, leading to inaccurate reporting and flawed decision making. This is where a dedicated tool becomes essential. A Percentage Difference Calculator provides clear, instant mathematical comparisons between any two numbers. Instead of spending time recalculating formulas by hand or building spreadsheet formulas from scratch, you can enter your figures and instantly view signed percentage change, absolute difference, and relative change compared to your starting baseline.
What is a Percentage Difference Calculator?
A Percentage Difference Calculator is an online numerical utility designed to compare two values and quantify the gap between them. Rather than delivering a single isolated answer, a thorough calculator provides multiple analytical perspectives on how your numbers relate to each other. To understand how the tool operates, it helps to break down the core outputs it provides:
Signed Percent Change
This metric measures the directional shift from an initial value to a secondary value. If the new value is higher than the original, the calculation yields a positive result, showing a percent increase. If the new value is lower, the result is negative, indicating a percent decrease. The sign clearly communicates direction.
Absolute Difference
This calculation ignores direction entirely. It subtracts one number from the other and takes the absolute value, displaying the positive distance between the two points. This metric is useful when you simply need to know how far apart two quantities are without concern for which one came first.
Relative Change
Relative change evaluates the scale of difference compared to the initial reference point. Expressed as a decimal ratio or percentage, it puts raw numbers into context. A shift of ten units means something very different when starting from twenty than it does when starting from ten thousand. By presenting these complementary metrics simultaneously, the calculator removes ambiguity and helps you choose the exact figure required for your specific report or study.
The Math Behind Value Comparisons
Understanding the conceptual logic behind these metrics helps clarify why choosing the right comparison matters. When you calculate percent change, the order of your inputs is critical. The math always uses the first number as the anchor or baseline. The baseline acts as the denominator in the formula. If your starting number changes, the resulting percentage changes even if the raw numerical gap stays identical. For example, moving from 50 to 75 represents a gain of 25 units. Relative to the starting number of 50, that gain is a 50 percent increase. Conversely, moving from 75 down to 50 is a reduction of 25 units. But because the baseline is now 75, that same raw gap represents a 33.3 percent decrease. In contrast, true percentage difference treats both values symmetrically. Instead of picking one number as the strict baseline, it divides the absolute difference by the average of the two numbers. This approach is common in laboratory settings where neither measurement is considered the absolute reference standard.
Key Features and Benefits
Manual mathematical calculations leave room for error, especially when working under tight deadlines or processing large amounts of data. Utilizing a reliable online calculator offers several practical advantages for your workflow. * Instant Real Time Results: Calculations occur as soon as values are typed into the input fields, enabling fast comparative analysis.
- Multiple Metric Outputs: View signed percentage change, absolute difference, and relative change together in a single clean view.
- Error Free Processing: Eliminates common mistakes such as incorrectly ordered denominators or inverted signs.
- Handles Varied Inputs: Works smoothly with positive numbers, negative values, and decimals without breaking the mathematical logic.
- Easy to Use Layout: Designed for quick entry without unnecessary steps, complex settings, or hidden options.
Step by Step Guide on How to Use It
Using the calculator involves just a few simple steps. Here is how to complete your calculations quickly.
Step 1: Input the Starting Baseline Value
Place your initial figure into the first field. In scenarios tracking trends over time, such as last month revenue or baseline test results, this entry serves as your starting point.
Step 2: Input the Comparison Value
Enter your second number into the final value field. This represents your new measurement, updated period figure, or alternative data point.
Step 3: Evaluate the Output Metrics
Once both entries are filled, the calculator processes the values automatically. Review the generated metrics:
Signed percent change to assess exact percentage growth or drop.
Absolute difference to view the raw scalar gap.
Relative change to assess the proportion of movement against the original figure.
Step 4: Apply Your Findings
Copy the specific metric required for your spreadsheet, presentation slide, or research report.
Why You Need This Tool: Primary Use Cases
Numeric comparisons occur across every professional and academic discipline. Here is how different fields rely on these calculations.
Financial
Analysis and Stock Tracking Investors track asset performance continuously. If a share price shifts from an opening rate to a closing rate, calculating signed percent change shows exact market gains or losses. It allows portfolio managers to evaluate relative performance across assets of varying values.
Business
Performance and Sales Growth Corporate teams rely heavily on percent increase calculator outputs to evaluate operational progress. Comparing current quarter sales against historical baselines reveals growth trajectories clearly. When tracking operational costs, monitoring relative change helps managers catch budget overruns before they impact profitability.
Online
Retail and Pricing Strategies Merchants regularly discount products or adjust prices based on supply chain costs. Calculating percent decrease figures allows store owners to plan promotional discounts accurately while protecting profit margins.
Scientific
Research and Experiments In physics, chemistry, and biology laboratories, measurements are rarely static. Scientists compare empirical trial results against theoretical targets or control baseline values. Displaying relative change and absolute difference helps researchers measure experimental variance and report error margins accurately.
Personal
Finance and Expense Tracking On an individual level, comparing utility bills, monthly grocery spending, or savings goals requires evaluating changes over time. Computing percentage movement clarifies where spending has grown or shrunk, helping keep personal budgets on track.
Frequently Asked Questions
What is the difference between percent change and percentage difference?
Percent change relies on a strict order, comparing an initial baseline value to a final value to show growth or decline. Percentage difference compares two values without assigning one as the starting point, usually dividing their difference by their shared average.
Can a percent change output be negative?
Yes. If your secondary comparison value is smaller than your initial starting value, the calculation produces a negative result, indicating a percent decrease.
Why does swapping the order of numbers change the percentage result?
Because relative change measures movement as a fraction of the initial starting value. Changing the starting value alters the denominator of the underlying equation, which changes the final percentage ratio.
How does the tool handle negative numbers?
The calculator follows standard algebraic rules. If you enter negative inputs, it computes the directional shift accurately, taking double negatives and sign reversals into account.
Is relative change the same as relative error?
They use similar math, but relative change compares two observed values over time or across conditions. Relative error specifically compares an observed experimental value to a known standard or theoretical value.
Summary of Key Points
Accurate numeric comparison is fundamental for sound decision making, business reporting, and academic study. Relying on manual math or memory often introduces minor mistakes that distort your overall analysis. By generating signed percent change, absolute difference, and relative change in a clear side by side layout, the Percentage Difference Calculator simplifies data analysis. It yields immediate, verified outputs so you can analyze figures with total confidence and present your conclusions accurately.