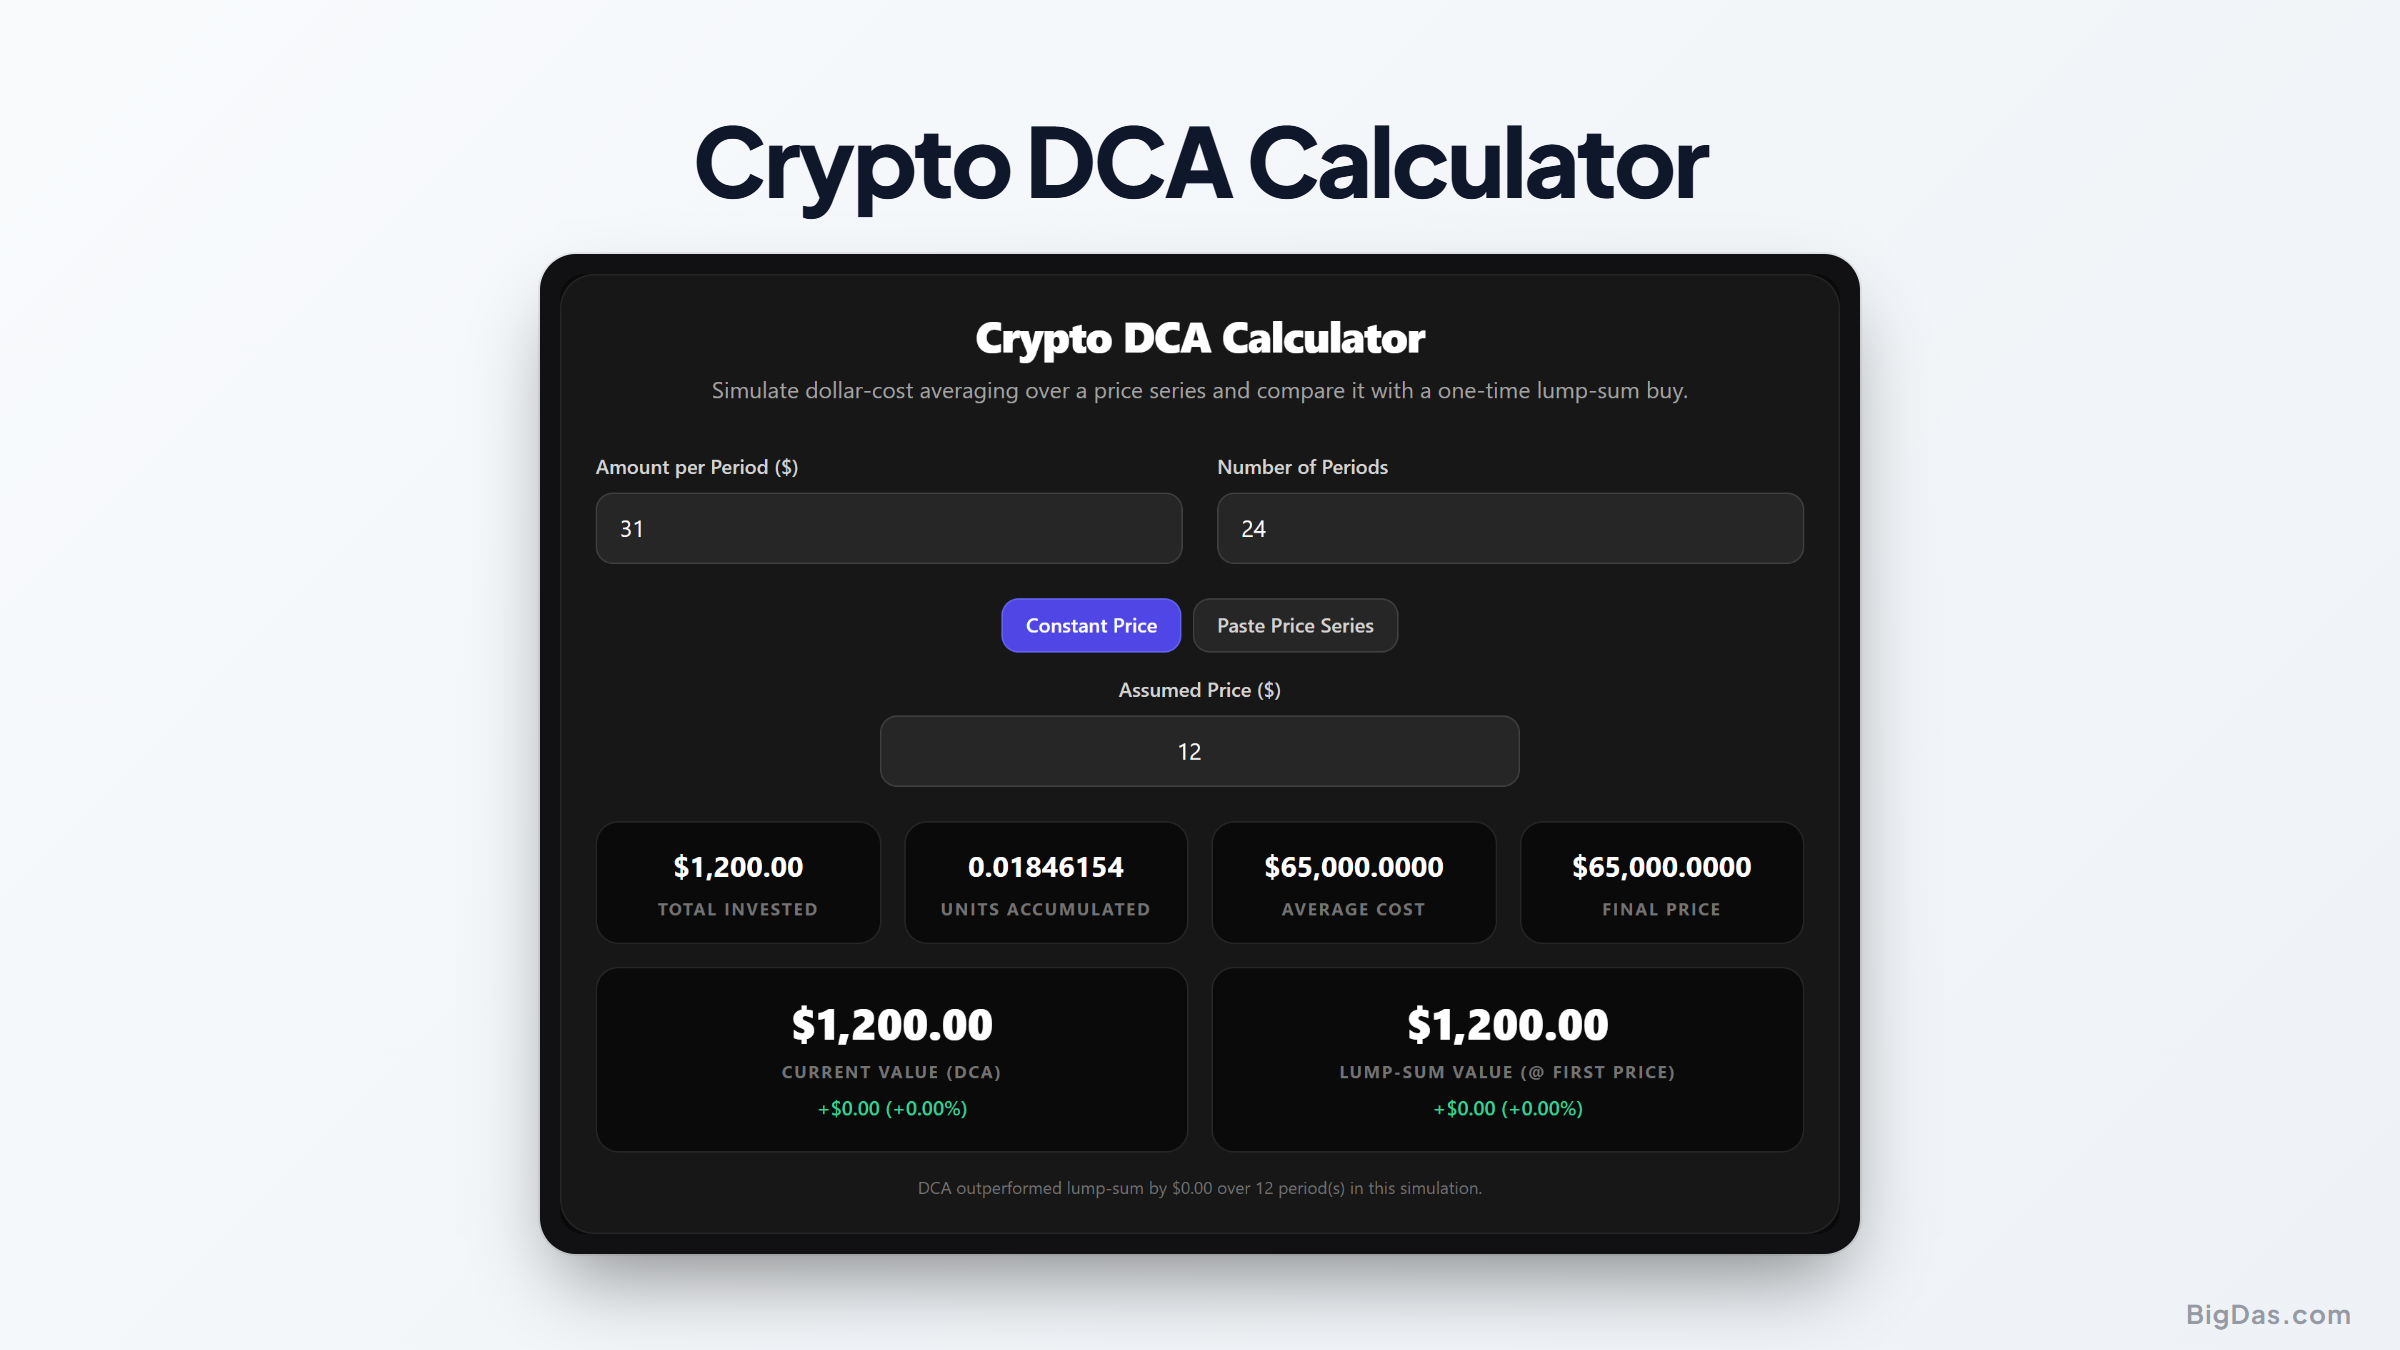
Crypto DCA Calculator
 Generated infographic and interface snapshot for Crypto DCA Calculator
How to Use a Crypto DCA Calculator
Crypto prices can move 10% or more in a single day, which makes timing the market nearly impossible. Most investors who try to buy bottoms and sell tops end up making emotional decisions and losing money.
Dollar cost averaging (DCA) solves this. You invest a fixed amount on a schedule, buy more units when prices drop and fewer when they rise, and let the average cost work itself out.
A crypto DCA calculator simulates this process using historical data. You input your amount, frequency, and timeframe, and the tool shows you what DCA would have returned, and how it compares to investing everything at once.
What is a Crypto DCA Calculator?
A crypto DCA calculator is a tool that simulates a dollar cost averaging plan. You set the investment amount, the interval (daily, weekly, monthly), and the period. The calculator pulls historical prices for the chosen asset and runs the numbers.
DCA works because your fixed dollar amount buys more units at lower prices and fewer at higher prices. Over time, this pulls your average cost below the simple average of the prices you bought at.
The calculator computes four main values:
- Total invested capital: the sum of every recurring purchase.
- Average purchase price: total invested divided by total units acquired.
- Current portfolio value: total units multiplied by the current price.
- Total return: gain or loss expressed as a percentage.
Here is a quick example. You invest $100 in month one at $100 per unit, so you buy 1 unit. In month two the price drops to $50, so $100 buys you 2 units.
Total Investment / Total Units Owned = Average Cost
$200 / 3 units = $66.67 per unit
The simple average of the two prices is $75. Because you bought more units when the price was lower, your true average cost is $66.67. A calculator runs this math across hundreds or thousands of historical data points to show what the strategy would have done over years.
Key Features and Benefits
Total invested capital. The sum of every recurring contribution. It makes it obvious how $50 a week turns into thousands over a few years.
Average purchase price. This metric is the main point of DCA. It shows how a fixed schedule smooths out volatility, so you are not stuck holding a single high entry price.
Current portfolio value. Calculated using today's market rate, so you can see your unrealized profit or loss right now.
DCA vs lump sum comparison. The tool runs a second scenario where you invest the full amount on day one, then compares the two side by side. The winner depends on the period you test, and seeing the actual numbers usually settles the debate for your specific situation.
Step by Step Guide
Select the asset. Most calculators include Bitcoin, Ethereum, and other major coins. Pick the one you want to test.
Enter the recurring amount. This is the dollar figure you can actually stick to, $10, $50, $100, whatever fits your budget.
Choose the frequency. Daily, weekly, biweekly, or monthly. Pick what matches how often you get paid.
Set the start and end dates. A 1-year window shows recent conditions. A 3- to 5-year window covers both bull and bear markets and gives a more realistic picture.
Run the calculation. Review the four metrics listed above plus the lump sum comparison.
Why You Need This Tool
Removes emotion. FOMO and panic selling are the two most common ways retail investors lose money. A pre-set schedule, tested against historical data, makes it easier to stick to a plan.
Works for small budgets. Not everyone has thousands of dollars to deploy at once. The calculator shows how $20 a week compounds into a meaningful position over several years.
Backtests bear markets. Run a simulation that starts at the peak of a bull run and continues through the crash that follows. You will see the average cost drop as the DCA buys continue through the dip, and the portfolio recover faster than most people expect.
Resolves the DCA vs lump sum question for your situation. A generic article cannot tell you which strategy is better for your capital, your time horizon, or the current market cycle. The calculator can, because it uses real numbers from the period you select.
FAQ
What is dollar cost averaging?
An investment strategy where you put in a fixed amount of money at regular intervals (weekly, monthly, etc.) regardless of price. You buy more units when prices are low and fewer when prices are high, which lowers your average cost over time.
How does an average cost calculator help me?
It tells you the average price you paid across all your purchases. In a volatile market, your buy prices will vary, and your break-even point depends on that average. The calculator does the math instantly.
Is DCA better than a lump sum investment?
It depends on the market and your risk tolerance. Lump sum usually wins when prices rise steadily after you buy. DCA wins when prices are flat, choppy, or falling, because it reduces the risk of buying at a local top. The historical data is mixed, which is why running both scenarios in the calculator is the right move.
Can I use a Bitcoin DCA calculator for other coins?
Yes. Most calculators support multiple assets. Bitcoin and Ethereum are the most common defaults, but altcoins are usually available.
How often should I make my recurring investments?
Whatever frequency you can sustain. Weekly and monthly are the most common. Consistency matters more than timing, the strategy only works if you keep doing it.
Summary
A crypto DCA calculator takes the guesswork out of building a long-term position. It uses historical price data to show you exactly what a fixed-schedule plan would have returned, and it puts the DCA vs lump sum question on a numerical basis instead of an opinion.
Pick an asset, set an amount and frequency you can sustain, and run the simulation. The output is a clear picture of what disciplined investing looks like in practice.