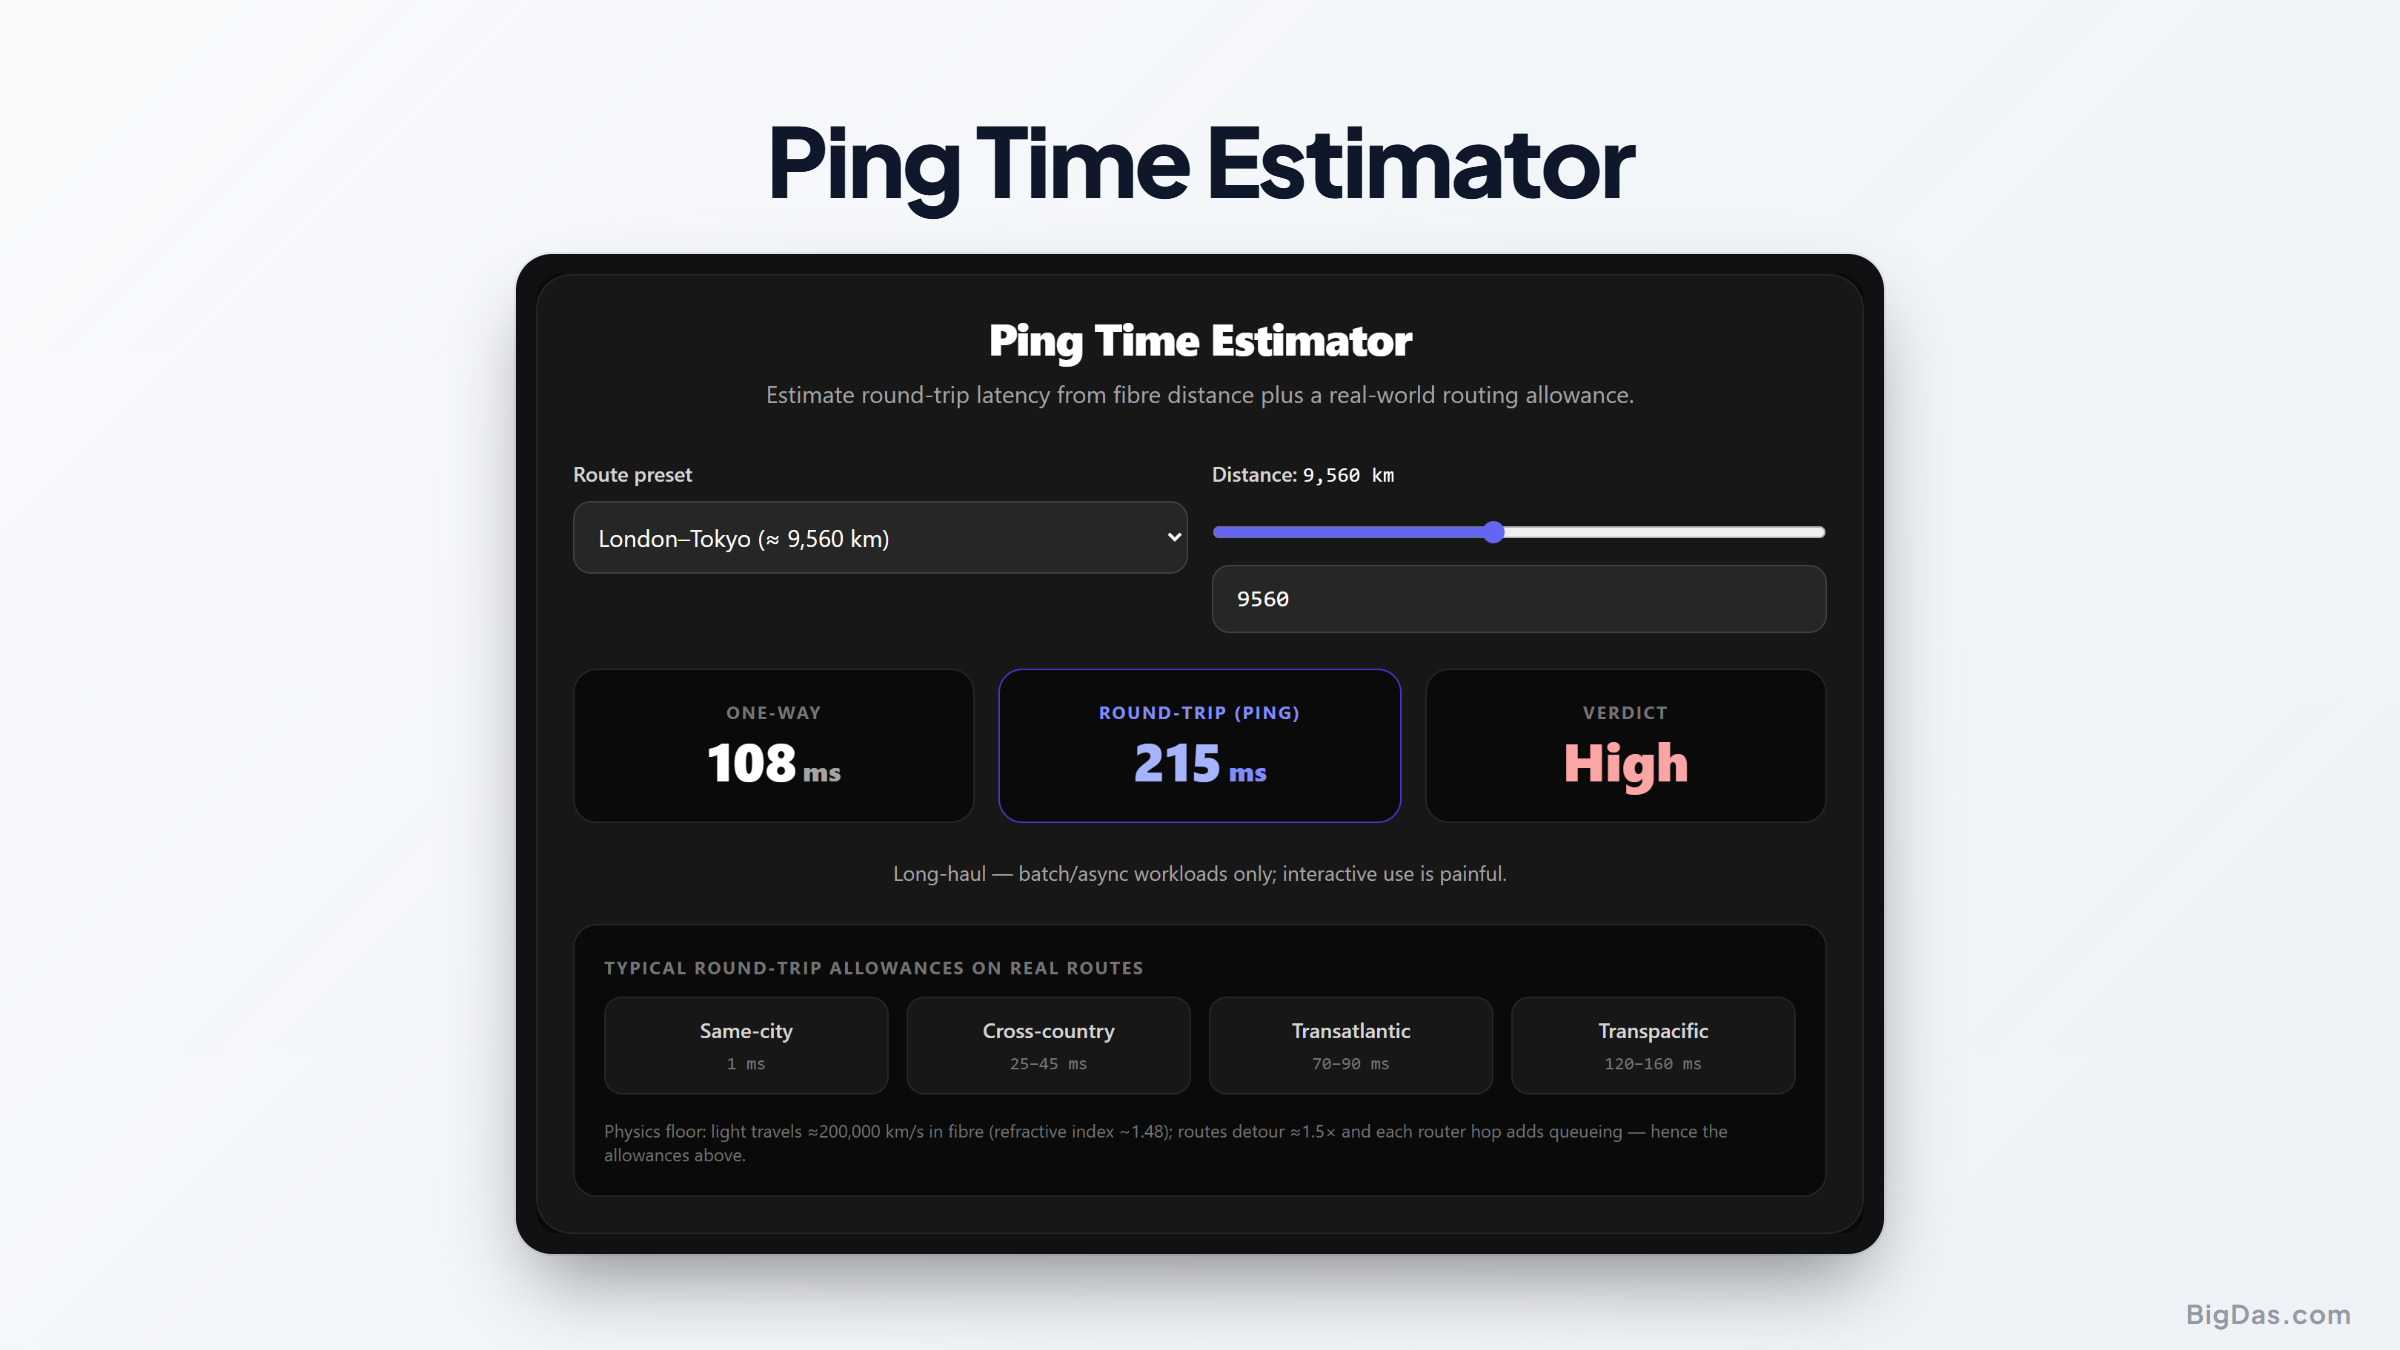
Ping Time Estimator
 Generated infographic and interface snapshot for Ping Time Estimator
Fiber Latency and Network Delay: Calculating Round Trip Time for Glass Fiber Networks
Data traveling across the internet is constrained by the laws of physics. Light through glass fiber optic cables does not move at its vacuum speed of roughly 300,000 km/s. Inside silica glass, optical refraction reduces this to approximately 200,000 km/s, which sets the absolute floor for network performance. Knowing how physical distance translates into network delay lets network engineers, system architects, and tech enthusiasts set realistic performance expectations. A specialized ping estimator calculates the baseline round trip time over fiber optic infrastructure anywhere in the world.
What is Ping Time Estimator?
A ping estimator is an online rtt calculator that predicts the minimum time required for a network signal to travel from a source to a destination and return. This round trip time (RTT) depends on distance, fiber material properties, and intermediate network equipment overhead. A standard live ping test measures actual instantaneous performance between two active network endpoints, but it cannot show whether high latency comes from physical distance or inefficient routing. The ping estimator fills that gap. It calculates the theoretical minimum fiber latency based on the speed of light in glass, then applies routing efficiency factors and hardware processing overhead to produce a realistic latency prediction.
The Physics Behind the Calculation
Light speed in glass fiber is governed by the refractive index of silica, which is typically around 1.468 for single mode optical fiber. Dividing the speed of light in a vacuum by this refractive index gives roughly 204,000 km/s. Signal propagation therefore requires about 4.9 microseconds per kilometer of glass. Because a ping test measures a full round trip, every 100 km of direct fiber optic cable adds approximately 1 millisecond of pure propagation delay.
Key Features and Benefits
Evaluating network paths accurately requires a model that combines optical physics with practical internet architecture. Main features of this latency calculator:
- Accurate Optical Physics Rules: Uses standard refractive index calculations to establish a baseline propagation speed of 200,000 km/s in glass fiber.
- Complete Round Trip Calculations: Automatically doubles the one way distance to calculate round trip delay.
- Realistic Global Route Presets: Built in route options for major transoceanic subsea cables and cross continent fiber links.
- Fiber Routing Factor Adjustments: Accounts for cable detours around geographical obstacles, municipal borders, and right of way constraints.
- Hardware Processing Overhead: Factors in routers, switches, and optical repeaters to present a realistic target ping rather than an impossible theoretical ideal.
Step by Step Guide on How to Use It
Estimating network delay for any connection requires only a few inputs.
Step 1: Enter the Geographical Distance
Input the direct physical distance between your source and target. Use kilometers or miles.
Step 2: Select a Predefined Route Preset
If you do not know the exact cable distance, select a built in global preset. Options include London to New York, Frankfurt to Tokyo, or Los Angeles to Sydney.
Step 3: Configure the Fiber Routing Overhead
Terrestrial and undersea cables weave around topography, shipping lanes, and municipal infrastructure. Standard internet fiber paths are usually 20 to 40 percent longer than a direct line. Select a routing efficiency setting that matches your pathway.
Step 4: Analyze Your Latency Breakdown
Review the detailed output. The results show theoretical minimum propagation delay, estimated hardware hop delays, and total expected round trip ping time in milliseconds.
Why You Need This Tool: Primary Use Cases
Baseline fiber latency matters in many technical fields.
Designing Distributed Cloud Systems
System architects placing resources across multi region cloud environments must account for network delay constraints. Calculating expected round trip times helps determine whether database synchronization or microservice calls across regions will meet application performance targets.
Auditing Telecommunication Service Level Agreements
Enterprise IT managers purchasing dedicated line internet or wavelength services can use a ping estimator to verify provider claims. If an ISP promises 15 ms between two locations but the physical light speed baseline for that distance is 22 ms, the claim is mathematically impossible.
Planning Multiplayer Game Server Locations
Game studios deploying multiplayer server fleets must choose geographic regions that offer fair latency. Estimating ping values ensures server nodes are placed where physical distance will not penalize surrounding users.
Diagnosing Network Congestion and Sub Optimal Routing
When a live ping test shows elevated latency, pinpointing the cause is difficult. If your measured ping is 120 ms but the latency calculator shows a baseline of 45 ms, the extra 75 ms comes from network congestion, sub optimal BGP routing, or overloaded equipment.
Optimizing High Frequency Financial Networks
Financial trading systems operate on microsecond margins. Network teams use latency calculations to evaluate optical fiber paths, compare subsea cable routes, and minimize routing hops between major financial exchanges.
Frequently Asked Questions
Why does light travel slower in fiber optic cables than in air?
Light travels fastest in a vacuum. When light moves through optical glass, it interacts with the silicon dioxide molecules in the medium. This optical density slows signal propagation to approximately two thirds of vacuum speed, yielding roughly 200,000 km/s.
Why is my actual ping test result higher than the estimated ping?
A physical ping estimator calculates propagation speed through glass plus standard routing overhead. Real world ping scores can be higher due to temporary network congestion, packet buffer queuing, firewall inspection, local wireless delay, or sub optimal routing protocols.
What is the minimum possible round trip latency across the Atlantic Ocean?
The direct physical distance between New York and London is approximately 5,500 km. Accounting for subsea cable routing on the ocean floor, the actual optical path is closer to 6,500 km. At 200,000 km/s in fiber, the pure propagation round trip is roughly 65 ms. Adding routing switches and hardware typically brings real world latency to 70 to 80 ms.
How do router hops affect total network delay?
Every router or switch along a path must read packet headers, check routing tables, and queue packets for transmission. On modern high speed fiber networks, each enterprise hop adds between 10 and 100 microseconds of processing delay under normal traffic.
Key Points to Remember
Physical distance and the speed of light through silica glass set the absolute limit for network performance. Modern hardware upgrades and routing optimizations can eliminate unnecessary delays, but no software configuration bypasses the physical speed limit of optical transmission. A ping estimator gives network engineers, developers, and IT managers a clear baseline to plan infrastructure, verify vendor claims, and identify bottlenecks.