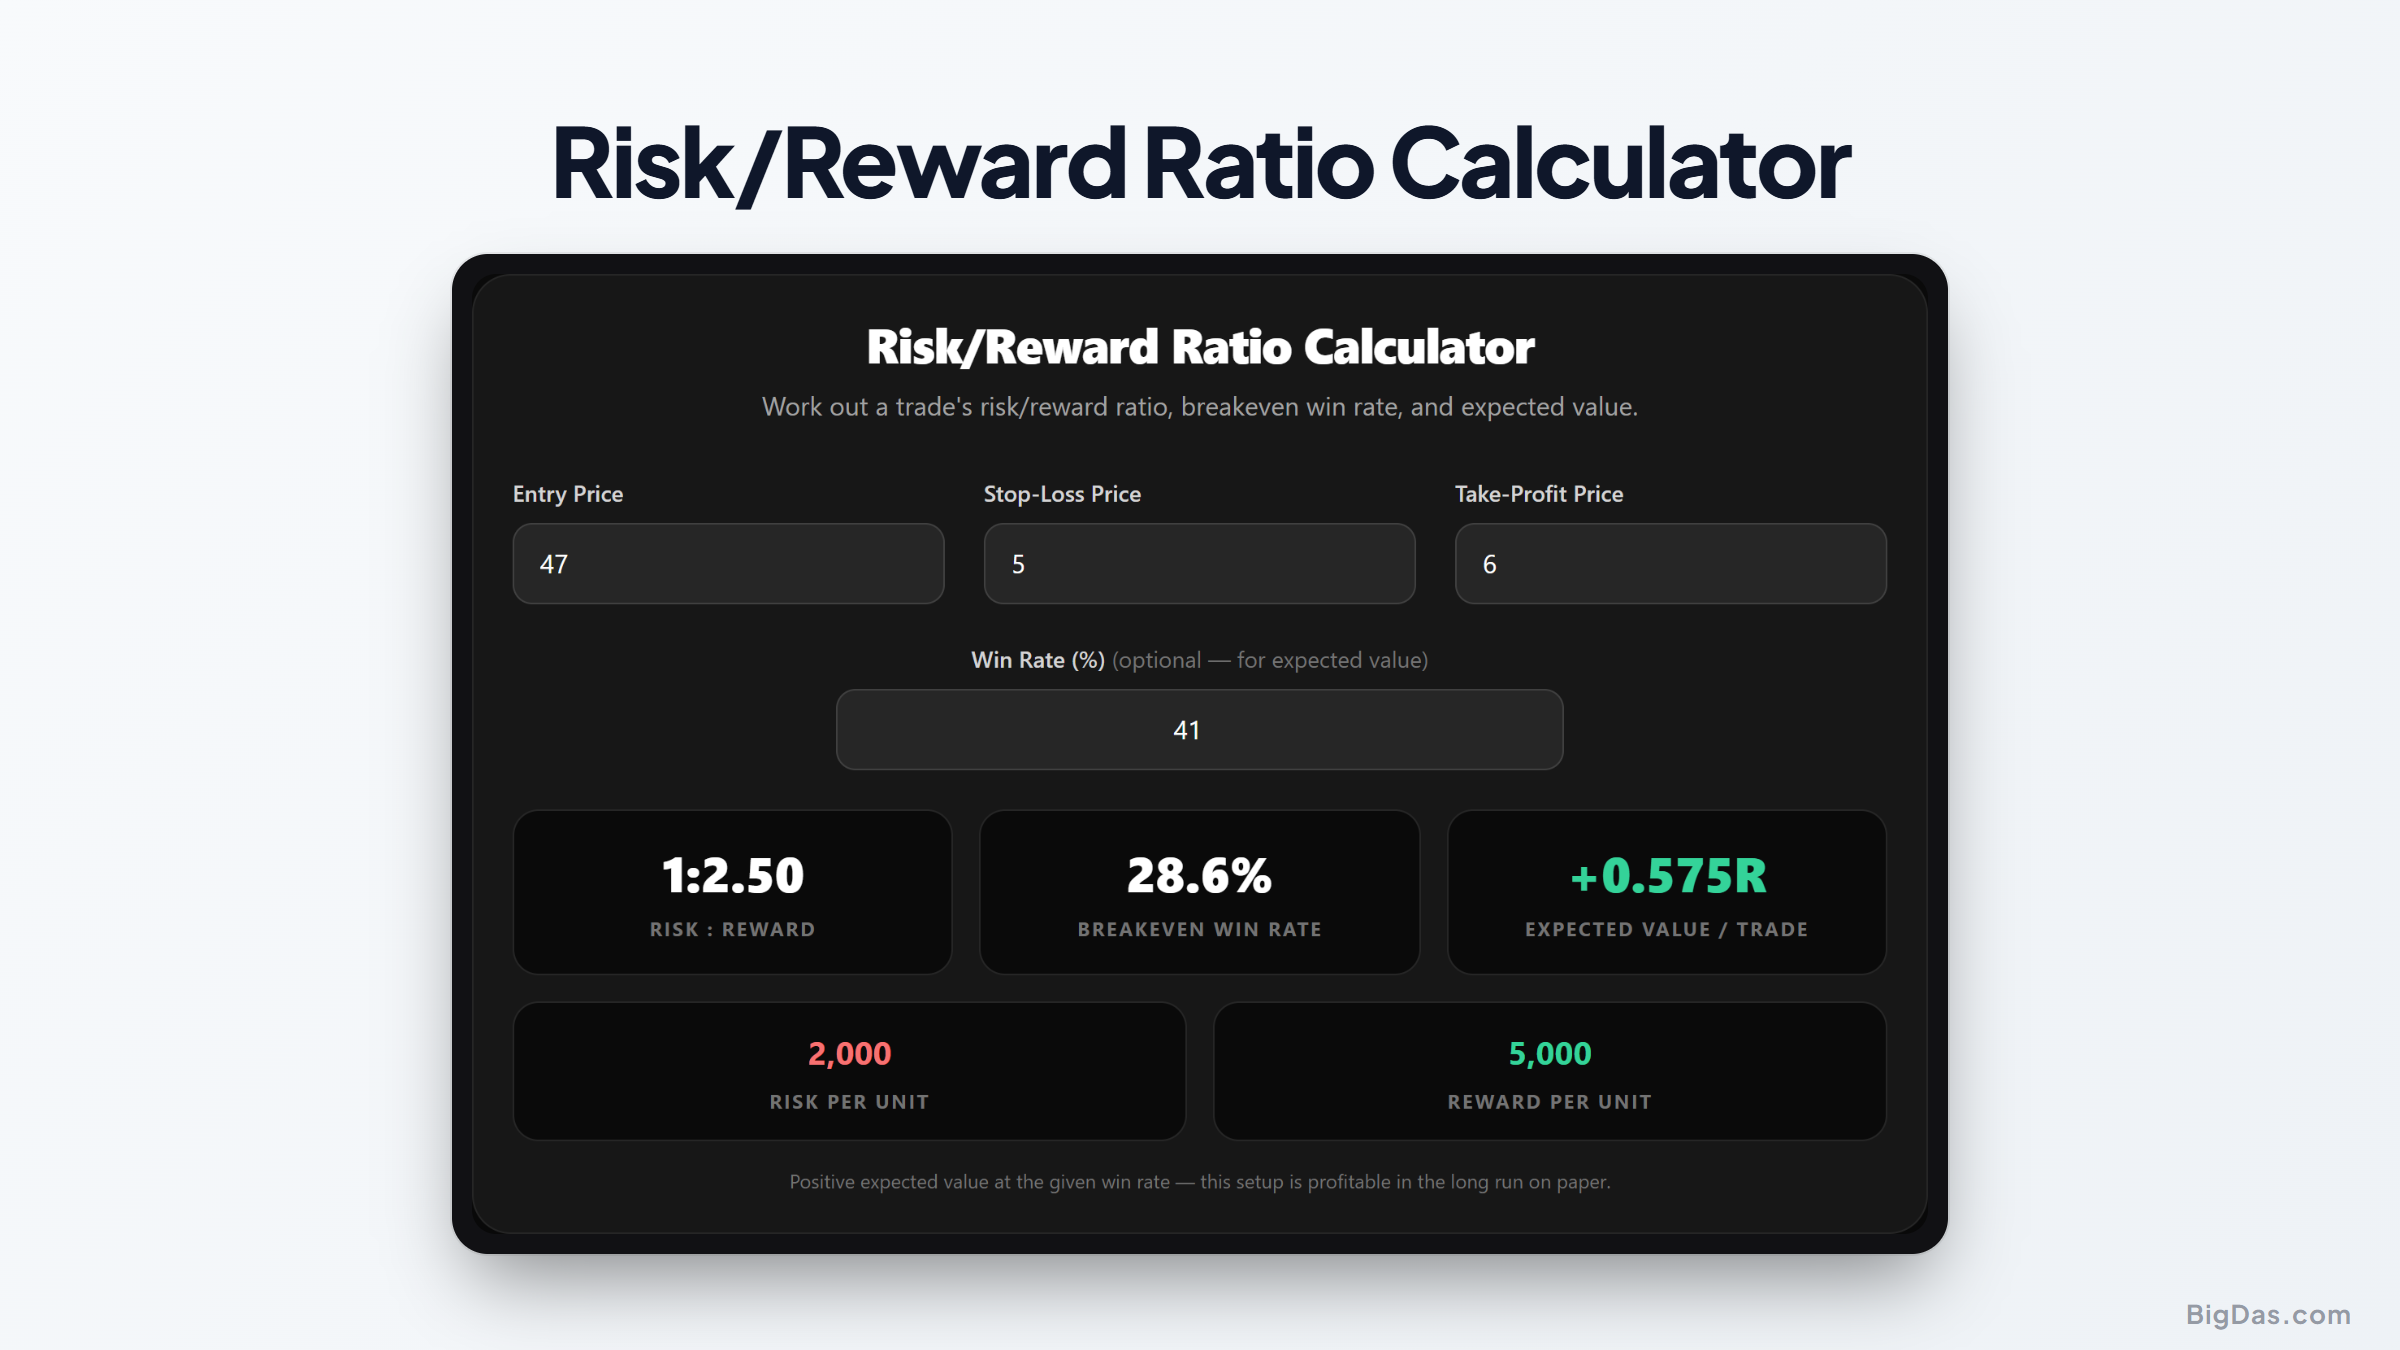
Risk/Reward Ratio Calculator
 Generated infographic and interface snapshot for Risk/Reward Ratio Calculator
Risk Reward Ratio Calculator: Trade Expectancy and Stop Loss Strategies
Trading without clear mathematical boundaries produces inconsistent results. Many traders focus on entry setups while overlooking the mechanics that drive long-term profitability: risk reward ratios, breakeven win rates, and expected value per trade. Every order has three reference points: entry price, stop loss, and take profit. Determining whether a setup has a positive statistical edge requires comparing the amount risked to the amount gained, then weighing that against your historical accuracy. A risk reward ratio calculator removes guesswork by converting trade parameters into clear metrics. It instantly computes your risk reward profile, minimum required win rate, and expected profit per trade, which keeps execution disciplined rather than emotional.
What is a Risk Reward Ratio Calculator?
A risk reward ratio calculator is a financial utility that evaluates potential return against potential loss for a given trade. You enter three price points, entry, stop loss, and take profit, and the tool returns the structural proportions of the order. An advanced version also calculates breakeven win rate and expected value.
- Risk Reward Ratio: The distance from entry to stop loss versus the distance from entry to take profit.
- Breakeven Win Rate: The percentage of trades you must win to avoid losing capital under the current risk reward profile.
- Expected Value: The average dollar amount or percentage return per trade over a statistically meaningful sample size.
Manual calculation before every order is slow and error-prone. The calculator delivers immediate feedback on whether a setup fits your trading plan.
Core Metrics Calculated by the Tool
The three metrics above interact directly. Understanding the relationships between them is the foundation of a sustainable strategy.
Risk Reward Ratio
The risk reward ratio measures potential loss against potential gain. If you risk $100 to make $300, the ratio is 1:3. A common mistake is taking setups where the loss outweighs the reward. The calculator confirms favorable asymmetry before you commit capital.
Breakeven Win Rate
Win rate alone does not determine profitability. The breakeven win rate depends entirely on the risk reward ratio:
- At a 1:1 ratio, you need a 50% win rate to break even.
- At a 1:2 ratio, the required rate drops to 33.3%.
- At a 1:3 ratio, it drops to 25%.
Conversely, a 2:1 risk reward setup (risking two units to gain one) requires a 66.7% win rate. The calculator surfaces this threshold instantly.
Expected Value per Trade
Trade expectancy is the most important metric in systematic trading. Expected value trading combines win probability, loss probability, average win size, and average loss size into a single result per trade. A positive expected value means the strategy will profit over many executions, even with individual losses. A negative expected value means the math is against you, regardless of short-term winning streaks.
Key Features and Benefits
An automated tool converts raw price charts into structured statistical models. Key benefits include:
- Automated Distance Calculations: Measures exact price, pip, or percentage distance between entry, stop loss, and take profit.
- Real-Time Adjustments: Move stop loss or take profit values on screen to see how small price shifts change trade expectancy.
- Capital Protection: Flags setups that require unrealistically high win rates to remain profitable.
- Integrated Position Sizing: Enter account balance and percentage risk per trade to get exact lot sizes or unit amounts alongside the risk metrics.
- Removal of Emotional Bias: Replaces intuition with objective feedback before you execute.
Step-by-Step Guide
Using the tool takes a few seconds once you identify a prospective setup.
Step 1: Select Your Direction
Choose long (buying) or short (selling with the expectation that price will drop).
Step 2: Enter Price Coordinates
Input your entry price, stop loss, and take profit. Use actual technical levels, support, resistance, swing highs, market structure, rather than arbitrary numbers.
Step 3: Define Account Parameters
Enter total account balance and the percentage of capital you want to risk (e.g. 1% or 2% of equity).
Step 4: Input Your Historical Win Rate
Enter your average strategy accuracy from past trading logs or backtesting. The tool uses this to calculate expected value per trade.
Step 5: Review the Output
Check the calculated results:
- Risk Reward Ratio (e.g. 1:2.5)
- Breakeven Win Rate percentage
- Dollar amount at risk vs. dollar profit target
- Expected value per trade
If expected value is positive and the breakeven win rate is well below your historical accuracy, the trade meets standard risk management criteria.
Practical Use Cases Across Markets
The principles apply across every asset class and execution style.
Day Trading Equity and Forex
Day traders operate in fast-moving environments. A scalper can plug in entry, stop loss, and take profit to confirm each order has a favorable risk/reward balance before execution.
Swing Trading Crypto and Commodities
Swing traders hold positions for days or weeks, facing larger swings and overnight gap risk. The calculator helps verify that target prices are realistic relative to structural resistance before committing capital.
System Backtesting and Strategy Optimization
When designing or testing a rules-based strategy, reviewing trade logs through an expectancy lens is essential. Backtesting reveals whether a low win-rate system with high rewards outperforms a high win-rate system with small targets.
Portfolio Risk Management
Fund managers and individual traders use expectancy calculations to limit portfolio drawdowns. Enforcing a minimum risk reward ratio across active orders preserves capital during volatility spikes.
Frequently Asked Questions
What is a good risk reward ratio for beginners?
A standard starting point is 1:2. Your potential reward is twice your risk. At this ratio, you only need a 33.3% win rate to break even, which leaves room for error while you learn.
How do you calculate trade expectancy manually?
Use this formula:
Expected Value = (Win Rate × Average Win Size) - (Loss Rate × Average Loss Size)
Example: You win 40% of trades with an average win of $300, and lose 60% with an average loss of $100.
(0.40 × 300) - (0.60 × 100) = 120 - 60 = $60
This setup yields a positive expected value of $60 per trade over time.
Can a strategy with a low win rate still be profitable?
Yes. A 30% win-rate strategy can be highly profitable if the average win is three or four times larger than the average loss. Win rate combined with reward proportion determines long-term profit, not win rate alone.
Why base stop loss levels on technical analysis instead of fixed ratios?
Your stop loss should sit at a level where the trade idea is proven invalid, below a major support level or above a recent swing high. Arbitrary distances meant only to hit a preferred ratio often get stopped out by normal market noise.
Summary
Consistent execution depends on strict risk management, not on predicting price movement. A risk reward ratio calculator converts price targets and entry parameters into clear metrics, showing breakeven win rates and expected values at a glance. Using these calculations routinely filters out high-risk setups, preserves capital, and supports a disciplined, process-oriented approach to trading.