
AI Research & Investment Trends

What the Tool Does
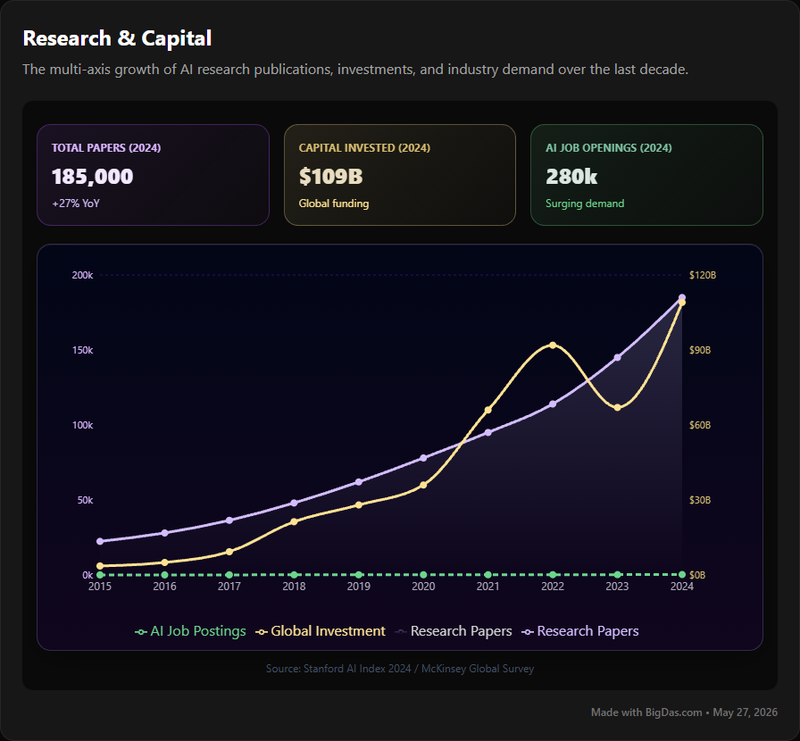
AI Research & Investment Trends tracks two metrics from 2015 onward: the number of AI research papers published each year, and the amount of global investment flowing into AI. The dataset covers roughly a decade, giving you enough history to spot real trends rather than short-term noise.
The data is pulled from academic sources (arXiv, Semantic Scholar, proceedings from NeurIPS, ICML, AAAI) and financial sources (VC funding rounds, public company filings, industry reports). Research data updates weekly; investment data updates daily.
Key Features
Research tracking
- Paper counts by sub-field (NLP, computer vision, reinforcement learning, AI ethics, etc.)
- Output by institution, author, and country
- Publication trends over time
Investment tracking
- Funding rounds by stage (seed, Series A, B, C+, public markets)
- Capital deployment by sector, geography, and investor type
- Deal sizes and valuation trends
Analysis tools
- Compare research output against investment in the same sub-field
- Cross-reference geographic patterns (US vs. China vs. Europe, etc.)
- Filter by date range, sector, keyword, or funding stage
- Export data as CSV, Excel, or image files
How to Use It
1. Start with the overview dashboard. It shows headline numbers: total papers published, total capital invested, and a comparison to the prior period. Use this to get a baseline before drilling down.
2. Pick a category. The left-hand panel splits the data into "Research Trends" and "Investment Trends." Choose the one that matches your question.
3. Apply filters. Narrow by timeframe, country, sector (healthcare AI, fintech AI, autonomous systems), or methodology (generative models, reinforcement learning, etc.). The keyword search works for both papers and deals.
4. Read the charts. Line graphs show publication growth over time; bar charts break down investment by sector; heatmaps show geographic activity. Hover for specific data points. Use the data tables beside each chart when you need exact numbers.
5. Export or set alerts. Save filtered views as custom reports, download the raw data, or configure notifications for new funding rounds or publication spikes in a specific area.
Who Uses It and Why
Investors (VCs, angels, fund managers)
- Spot sub-sectors where research output and early capital are both accelerating
- Benchmark target companies against broader market trends
- Track portfolio exposure to emerging or declining areas
- Avoid overpaying in saturated markets
Academic and R&D teams
- Back grant proposals with empirical trend data
- Find gaps in the literature where new work would have impact
- Identify leading institutions for collaboration
- Align applied research with areas that attract commercial funding
Business strategists and product managers
- Evaluate market entry by checking regional investment and research density
- Track competitors' patent filings (via their papers) and funding rounds
- Inform product roadmaps with technologies gaining traction
- Locate talent pools by institution and geography
Policymakers
- Measure a nation's standing in global AI research and capital flows
- Direct public funding toward areas with the highest leverage
- Identify international partners for joint research or investment
- Monitor work on AI safety, fairness, and ethics
Startup founders
- Validate an idea against current research and investment patterns
- Find active investors in a specific niche and typical valuation ranges
- Track competing startups' funding and publications
Frequently Asked Questions
Q1: What are the primary data sources?
A1: Research data comes from arXiv, Semantic Scholar, and major conference proceedings (NeurIPS, ICML, AAAI). Investment data comes from financial databases, VC tracking platforms, public filings, and industry reports. All sources are cross-referenced.
Q2: How often is the data updated?
A2: Research data updates weekly (sometimes daily for major releases). Investment data updates daily as new rounds are announced and verified.
Q3: Can I customize dashboards and reports?
A3: Yes. Filter by geography, sector, sub-field, date, or investment stage, then save the view as a custom dashboard or export it as a report.
Q4: Is the tool suitable for non-technical users?
A4: Yes. The interface presents data through charts, summaries, and high-level metrics. Technical users can drill into granular data; non-technical users can read the top-level trends without needing to understand the underlying models.
Q5: Does the tool provide full-text research papers?
A5: No. It indexes papers and provides metadata, abstracts, and trend analysis, then links to the original source. Full-text access depends on your institution's subscriptions or the paper's open-access status.
Q6: Can I track specific companies or investors?
A6: Yes. Search by investor name (specific VC firms, corporate venture arms) or company to see their full activity history.
Q7: What geographical coverage is available?
A7: Global. North America, Europe, Asia (with detail on China, India, and others), South America, Africa, and Australia. Filter to country level or view aggregated regional trends.
Q8: Is an API available?
A8: Yes, for enterprise subscriptions. The API lets you pull data directly into internal BI platforms, models, or custom applications.
Summary
AI Research & Investment Trends consolidates nearly a decade of AI research output and capital flows into one queryable platform. It gives investors a way to track deal flow against fundamental research activity, gives researchers a way to see where commercial interest is heading, and gives strategists and policymakers the longitudinal data needed to plan beyond the next funding cycle. The value is in the correlation: linking what gets published to what gets funded, and tracking both across time, geography, and sub-field.