
FIFA World Cup Statistics

FIFA World Cup Statistics: Goals and Titles Across Every Tournament
The FIFA World Cup runs every four years and produces a massive amount of historical data: every goal, every champion, and every shift in how the game is played at the highest level. This page covers what the FIFA World Cup Statistics tool does, how to use it, and who it's for.
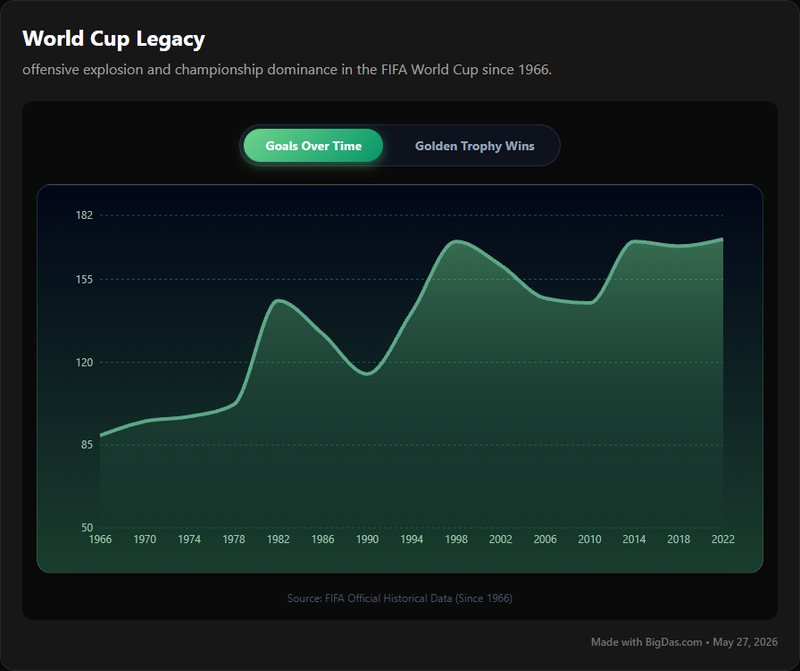
What is FIFA World Cup Statistics?
FIFA World Cup Statistics is a data tool that collects and presents historical records from every FIFA World Cup since 1930. It focuses on two core areas: goals scored across all tournaments and championship wins by nation.
You can look up the total goals in a specific tournament, compare how teams have scored across decades, or see which countries have lifted the trophy and when. The data is structured, searchable, and displayed in a way that makes long-term patterns easy to spot.
Key Features
Historical Data from 1930 Onward
The database covers every World Cup, from the 1930 tournament in Uruguay to the most recent competition. You don't need to cross-reference multiple sources; the records are in one place.
Goal Scoring Breakdown
Filter goals by tournament year, by team, or by era. For example, the 2022 tournament had 172 goals. You can also pull cumulative totals for a specific nation, such as Brazil's scoring history across all of their campaigns.
Championship Wins by Country
A dedicated section lists every World Cup winner in chronological order, with the year, host nation, and winning team. It also includes summary tables showing which countries have the most titles (Brazil: 5, Germany: 4, Italy: 4).
Interactive Charts and Graphs
The tool uses bar charts, line graphs, and timelines to visualize the data. Hovering over a data point usually shows the underlying number. This makes it easier to compare tournaments and spot trends.
Side-by-Side Comparisons
Compare two or more teams, tournaments, or eras. For instance, you can look at goal difference for winning teams in the 1970s against the 2010s, or compare how Brazil and Germany have performed across all their appearances.
Search and Filters
Search by year, team, or keyword. The interface is straightforward, so finding specific records takes seconds.
Data Export
Tables and charts can be downloaded as CSV (raw data), PDF (reports), or image files (PNG/JPEG). This is useful for journalists, researchers, and anyone building presentations.
How to Use It
Step 1: Open the Tool
Go to the platform. The main page usually shows a summary dashboard with overall totals, like the total number of goals scored in World Cup history.
Step 2: Choose a Section
The main navigation typically includes:
- Goals Scored: Tournament and team-level scoring data.
- Championship Wins: Historical list of winners.
- Tournament Overview: A broader view combining both.
Step 3: Apply Filters
In the Goals Scored section:
- Use the year filter to select a specific tournament (e.g. 1994, 2014).
- Use the team filter to select a nation (e.g. Germany, Brazil).
- Some tools let you select a date range to compare eras, like 1970 to 1990.
Step 4: Read the Visualizations
Results appear as tables, bar charts, line graphs, or pie charts. Hover over data points for exact figures. Take a moment to understand what each chart represents.
Step 5: Check Championship Wins
In the Championship Wins section, you'll find a chronological list of winners and a tally by country. This is the fastest way to verify who won which year.
Step 6: Export (Optional)
Click the Download or Export button near any table or chart. Choose CSV for raw data, PDF for a formatted report, or PNG for an image.
Who It's For
Journalists and Content Creators
Pull verified stats for articles, broadcasts, and social posts without digging through old records. Visualizations work well for infographics.
Analysts and Pundits
Track how scoring patterns have changed over time, or compare the consistency of top teams across decades. Useful for grounding opinions and predictions in actual data.
Educators and Students
The World Cup is a ready-made dataset for teaching averages, trends, and data visualization. Students can research topics like host nation performance or the global distribution of titles.
Casual Fans
Settle debates quickly: "How many times did Italy win before 2006?" "Which tournament had the most goals?" The data gives you a straight answer.
Researchers
The structured, exportable data works well for academic studies on sports sociology, historical trends, or statistical modeling.
FAQ
What data does the tool include?
Total goals per tournament, goals by team, and a record of every championship win (year, host, winning nation, runner-up).
How far back does the data go?
1930, the first World Cup, through the most recent tournament.
Does it include individual player stats?
It focuses on team and tournament-level data, but most sections also list the top individual goal scorers for each tournament and all-time.
How often is it updated?
Historical data is fixed. New tournaments are added after they conclude, with goals, results, and the championship outcome included.
Can I export the data?
Yes. Tables and charts can be exported as CSV, PDF, or image files.
Is it free?
It depends on the platform. Many versions are free or have a free tier. Check the specific site for pricing.
Where does the data come from?
Official FIFA records and cross-referenced historical sports databases.
Can I compare teams or tournaments?
Yes. The comparison feature lets you view multiple teams or tournaments at once, showing goals, trends, and titles side by side.
Summary
FIFA World Cup Statistics compiles goals and championship data from every World Cup into a searchable, visual format. It works for journalists who need fast facts, analysts who want historical context, teachers looking for real-world data examples, and fans who want to settle arguments with something more reliable than memory. The export options make it easy to use the data in outside projects, and the visualizations help make decades of football history readable at a glance.