Unlocking NBA Excellence: Your Ultimate Guide to NBA Season Leaders for Basketball Performance Data

NBA Season Leaders

NBA Season Leaders Header Image

Unlocking NBA Excellence: Your Ultimate Guide to NBA Season Leaders for Basketball Performance Data

The world of professional basketball is a kaleidoscope of athletic prowess, strategic brilliance, and unforgettable moments. At its heart lies the incredible individual and collective performances of its players. For fans, analysts, fantasy managers, and even professional scouts, keeping track of the truly elite, those who consistently dominate the stat sheets, can be a passion, a profession, and sometimes, a challenging endeavor. The sheer volume of games, players, and metrics can be overwhelming, making it difficult to pinpoint who truly stands out in a given season.

Imagine having a dedicated lens, a powerful resource that cuts through the noise and spotlights the absolute best in the game. A tool that not only identifies but clearly presents the top performers across the most critical statistical categories: points, assists, and rebounds. This is precisely where the NBA Season Leaders tool establishes itself as an indispensable asset, transforming raw data into actionable insights and enriching the understanding of NBA basketball at its highest level.

This comprehensive guide delves into the essence of the NBA Season Leaders tool, exploring its foundational purpose, unveiling its robust features, and demonstrating exactly how to leverage its capabilities. Whether you're a seasoned sports analyst, a dedicated fantasy players manager, a curious fan, or someone who appreciates when data is beautiful and presented with clarity, you'll discover how this resource elevates your engagement with and understanding of the NBA.

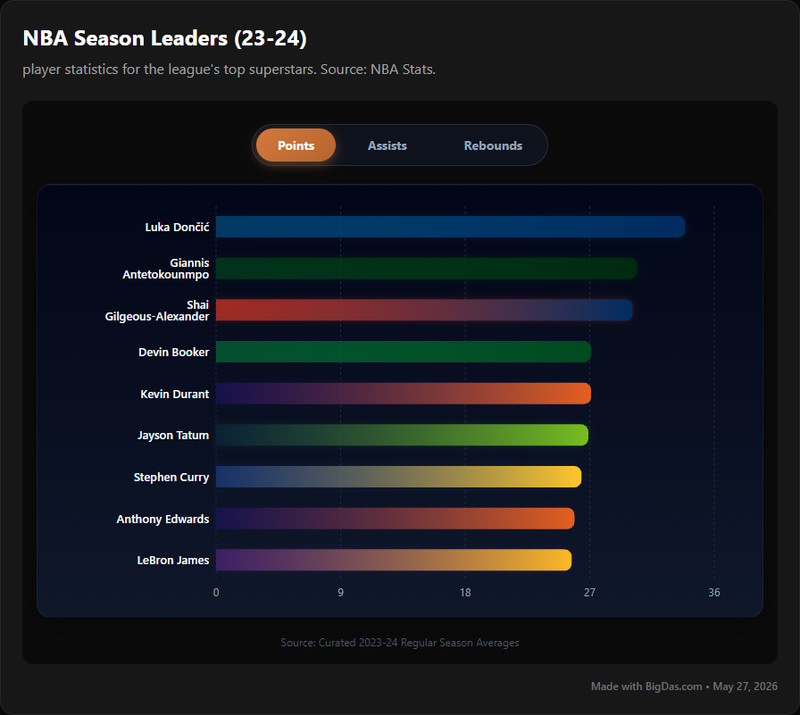
NBA Season Leaders Chart

What is NBA Season Leaders?

At its core, NBA Season Leaders is a specialized, meticulously curated digital platform designed to provide an unequivocal view of top individual player performance across key statistical categories for any given NBA season. It acts as a definitive leaderboard, spotlighting the players who consistently excel in scoring, facilitating plays, and dominating the glass.

The primary objective of this tool is to centralize and simplify access to critical performance metrics that define individual excellence on the basketball court. Instead of sifting through countless game logs, league-wide statistics pages, or disparate sources, NBA Season Leaders aggregates and presents the most impactful data points:

  • Points: Identifying the league's most prolific scorers, the offensive engines who consistently put the ball in the hoop.
  • Assists: Highlighting the playmakers and facilitators, those who create scoring opportunities for their teammates with precision and vision.
  • Rebounds: Showcasing the relentless warriors of the paint, the players who control possessions by securing offensive and defensive boards.

This tool is more than just a list; it's a dynamic snapshot of the league's top talent, updated regularly to reflect ongoing season performance. It distills complex NBA basketball statistics into an easily digestible format, making it accessible to anyone interested in understanding who truly leads the pack. For those who believe data is beautiful when it tells a compelling story, NBA Season Leaders offers a clear narrative of individual supremacy in the most competitive sports league in the world.

Key Features & Benefits of NBA Season Leaders

The NBA Season Leaders tool is engineered with functionality and user experience at its forefront, offering a suite of features that provide significant benefits to its diverse user base. Here’s a closer look:

Comprehensive Performance Tracking (Feature)

The tool provides an exhaustive list of top players for points, assists, and rebounds, ensuring users have a complete overview of the league's statistical elite.

  • Benefit: Eliminates the need to visit multiple sources or manually compile data, saving time and guaranteeing accuracy. All critical performance data is centralized.

Season-Specific Leaderboards (Feature)

Users can select and view leaderboards for current, recent past, and historical NBA seasons. This allows for both real-time tracking and retrospective analysis.

  • Benefit: Facilitates historical context and trend analysis. Users can compare player performance across different seasons, tracking career trajectories or identifying peak seasons. It’s invaluable for understanding the longevity and consistency of players.

Granular Statistical Breakdown (Feature)

Beyond just totals, the tool often includes per-game averages, efficiency ratings, and sometimes even advanced metrics like true shooting percentage (TS%) or assist-to-turnover ratio for individual players featured on the leaderboards.

  • Benefit: Provides deeper insights into player effectiveness. It moves beyond raw volume to explain how a player achieves their numbers, offering a more nuanced understanding of their impact on basketball games. This satisfies those who seek depth in data is beautiful.

Intuitive User Interface (Feature)

Designed for clarity and ease of navigation, the interface presents complex NBA statistics in an organized, visually appealing manner. Leaderboards are clearly structured, and player profiles are easily accessible.

  • Benefit: Reduces the learning curve and enhances user engagement. Even novice users can quickly find the information they need, making the tool accessible to a wide audience of sports enthusiasts. The presentation itself emphasizes that data is beautiful when it's well-designed.

Player Profile Drill-Down (Feature)

Clicking on any player within a leaderboard provides access to a more detailed profile page, showcasing their full seasonal stats, career averages, team information, and potentially biographical details.

  • Benefit: Offers a holistic view of individual players. This feature is crucial for in-depth research, fantasy basketball management, or simply satisfying curiosity about a player's complete performance history.

Comparative Analysis Capabilities (Feature)

Some iterations of the tool allow users to select multiple players and compare their statistics side-by-side across various metrics, helping to visualize differences and similarities.

  • Benefit: Enables direct evaluation and informed decision-making. Whether for fantasy drafts, betting considerations, or debate among friends, comparing NBA stars directly provides compelling insights into their relative strengths and weaknesses.

Data Visualization (Feature)

Often includes charts, graphs, and heatmaps that visually represent player performance and trends over time or against league averages.

  • Benefit: Makes complex statistical relationships immediately understandable. Visuals transform raw numbers into compelling narratives, proving that data is beautiful when it's presented dynamically, aiding in quick comprehension and impactful presentations for analysts.

Export and Sharing Options (Feature)

Allows users to download selected data sets (e.g., top 20 players for assists in 2023) into formats like CSV or PDF, and share direct links to specific leaderboards or player profiles.

  • Benefit: Facilitates further analysis, reporting, and collaboration. Professionals can integrate data into their own models, while fans can easily share interesting findings with communities or friends, enhancing the communal aspect of sports fandom.

These features collectively empower users with an unparalleled ability to track, analyze, and understand NBA player performance, making NBA Season Leaders a cornerstone resource for anyone serious about basketball analytics.

Step-by-Step Guide on How to Use NBA Season Leaders

Navigating the NBA Season Leaders tool is designed to be intuitive and efficient, allowing users to quickly access the rich performance data they seek. Here’s a simple guide to get you started:

Step 1: Access the Tool

  • Open your web browser and navigate to the official NBA Season Leaders platform URL. (e.g., www.nbaseasonleaders.com or a dedicated section on a larger sports data site).

Step 2: Select Your Desired Season

  • Upon arrival, you'll typically see the current NBA season's leaderboards by default.
  • Locate the "Season Selector" (often a dropdown menu or a set of clickable year buttons) usually positioned near the top of the page.
  • Click on the dropdown or button and choose the specific NBA season you wish to explore (e.g., "2023-24," "2010-11," "1997-98"). The page will refresh to display data for your selected season.

Step 3: Choose Your Statistical Category

  • The primary categories (Points, Assists, Rebounds) are prominently displayed, often as distinct tabs, buttons, or a second dropdown menu.
  • Click on the category you are interested in (e.g., "Points"). The leaderboard will update to show the top players for that specific statistic.
  • You can switch between "Points," "Assists," and "Rebounds" at any time to view different leaderboards.

Step 4: Explore the Leaderboard

  • The main section of the page will now present a clear, ranked list of players for your chosen season and statistic.
  • Each entry typically includes:
    • Rank: The player's position on the leaderboard.
    • Player Name: The name of the NBA player.
    • Team: The team the player played for in that season.
    • Stat Value: The total or average value for the chosen category (e.g., 2,500 points, 10.5 assists per game, 12.1 rebounds per game).
    • Additional Metrics: Often includes games played, minutes played, and other relevant per-game or advanced stats.
  • Scroll down to view more players on the list. Many leaderboards are paginated or allow for infinite scrolling.

Step 5: Drill Down into Player Profiles (Optional)

  • To learn more about a specific player, simply click on their name within the leaderboard.
  • This action will typically take you to a dedicated player profile page.
  • On the player profile, you can find:
    • Detailed seasonal statistics for the selected year.
    • Career statistics.
    • Biographical information.
    • Potentially game logs or historical performance charts.
  • Use the "Back" button in your browser or a navigation link on the site to return to the leaderboards.

Step 6: Utilize Advanced Filters and Comparisons (If Available)

  • Look for "Filters" or "Advanced Options" sections. These might allow you to:
    • Filter by position (e.g., "Guard," "Forward," "Center").
    • Filter by team.
    • Adjust minimum games played to qualify for leaderboards.
    • (If available) Select multiple players for a side-by-side comparison using a "Compare Players" feature.
  • Apply your filters, and the leaderboard will dynamically adjust to show the results.

By following these straightforward steps, you can efficiently navigate the NBA Season Leaders tool to extract valuable basketball performance data, enhancing your understanding and appreciation of the league's top players. This intuitive design ensures that anyone who values clear, accessible data can put it to use.

Why You Need This Tool: Uncovering Use Cases for NBA Season Leaders

The NBA Season Leaders tool is not just a database; it’s a powerful analytical instrument with diverse applications across a spectrum of sports enthusiasts and professionals. Its ability to simplify complex NBA basketball statistics makes it invaluable for various use cases, proving that when data is beautiful and accessible, it empowers better decisions and deeper understanding.

1. Fantasy Basketball Managers

  • Use Case: Drafting, trade analysis, waiver wire pickups, and daily lineup optimization.
  • How it Helps: Managers can quickly identify consistent top performers in points, assists, and rebounds, which are core categories in most fantasy leagues. Historical data helps predict future performance and assess player value for trades. Detailed player profiles reveal underlying stats important for niche league rules. For dynasty leagues, tracking year-over-year performance is critical for valuing young players or potential declines.

2. Sports Bettors and Analysts

  • Use Case: Informing proposition bets (player points, assists, rebounds over/under), identifying value in futures bets (MVP, Defensive Player of the Year), and understanding team dynamics.
  • How it Helps: Bettors can quickly see who the truly dominant players are in specific statistical areas. This allows for more informed decisions on individual player props. If a player is consistently topping the rebound charts, they might be a good bet for a "rebounds over" prop. The tool helps establish a baseline for elite performance, crucial for evaluating odds set by bookmakers.

3. Media Analysts and Journalists

  • Use Case: Crafting compelling narratives, supporting arguments with data, preparing for broadcasts, and fact-checking claims about NBA performance.
  • How it Helps: Journalists and commentators need quick access to accurate, verifiable statistics. This tool provides instant leaderboards for points, assists, and rebounds, enabling them to cite top players and their achievements effortlessly. It allows for articles like "Who leads the league in assists this season?" or "Has anyone matched LeBron's rebound totals at this age?" to be written with confidence and precision.

4. Coaches and Scouts (Amateur to Professional)

  • Use Case: Identifying top talent, scouting opponents, evaluating player development, and understanding league-wide trends.
  • How it Helps: While professional teams have sophisticated analytics departments, the NBA Season Leaders tool provides a high-level overview of who is performing at an elite level across the most fundamental statistical categories. A scout might use it to quickly see if a particular player is consistently improving their rebounding numbers year-over-year, indicating a potential area of growth or specialization. It’s an accessible starting point for deeper dives into player performance.

5. Casual Basketball Fans and Enthusiasts

  • Use Case: Enhancing game watching experience, winning debates among friends, deepening understanding of player impact, and simply appreciating greatness.
  • How it Helps: Fans can easily verify who truly leads in their favorite categories. "Is Curry still leading in points?" or "Who has more assists, Jokic or Haliburton?" – these questions can be answered instantly. It makes following NBA basketball more engaging by putting objective performance data at their fingertips, reinforcing that data is beautiful in its ability to clarify competition.

6. Educators and Students (Sports Analytics, Statistics)

  • Use Case: Learning about sports analytics, understanding statistical concepts in a real-world context, and conducting research projects.
  • How it Helps: The clear presentation of NBA statistics serves as an excellent case study for data analysis. Students can use the tool to explore trends, compare players, and apply statistical methods to real-world sports data, understanding how points, assists, and rebounds contribute to overall player value and team success. It’s a tangible example of how data is beautiful when used for educational purposes.

By providing easily digestible, comprehensive data on NBA player performance, NBA Season Leaders empowers a wide range of users to engage with basketball in a more informed and analytical way. It translates raw numbers into compelling insights, making it an indispensable resource for anyone who values the beauty and power of sports data.

Frequently Asked Questions about NBA Season Leaders

To further assist users and provide clarity, here's a compilation of frequently asked questions regarding the NBA Season Leaders tool.

Q1: How often is the data updated in NBA Season Leaders?

A1: The data for the current NBA season is typically updated daily, shortly after all games conclude. This ensures that the leaderboards reflect the most recent player performances in points, assists, and rebounds. Historical season data is static and accurate as of the conclusion of those respective seasons.

Q2: Can I view historical NBA season data, or is it only for the current season?

A2: Yes, absolutely. The NBA Season Leaders tool provides access to leaderboards for numerous past NBA seasons. You can use the "Season Selector" (usually a dropdown menu) to choose any available historical year and view the top players for points, assists, and rebounds from those seasons.

Q3: What statistical categories are covered by the NBA Season Leaders tool?

A3: The primary statistical categories covered are Points, Assists, and Rebounds. While detailed player profiles might include additional statistics (like steals, blocks, turnovers, field goal percentages), the main leaderboards focus on these three core performance metrics to highlight the most impactful offensive and rebounding players.

Q4: Is there a way to filter leaderboards by team or player position?

A4: Many advanced versions of the NBA Season Leaders tool include filtering options. Look for features like "Filters," "Advanced Search," or "Refine Results" which may allow you to narrow down the leaderboards by specific NBA teams or player positions (e.g., Guard, Forward, Center). This helps in conducting more specific analysis.

Q5: Can I compare multiple NBA players side-by-side using this tool?

A5: Depending on the specific iteration of the tool, a player comparison feature might be available. If present, you'll typically find an option to "Add to Compare" or "Select Players for Comparison" next to player names on the leaderboards or within their individual profiles. This feature is highly valuable for direct statistical evaluation.

Q6: Does the tool include advanced metrics beyond raw totals/averages?

A6: Yes, for each player listed on the leaderboards, their individual profile usually includes more granular statistics such as per-game averages, efficiency metrics (e.g., minutes played per game), and sometimes more advanced analytics like True Shooting Percentage (TS%) or Assist-to-Turnover Ratio. This provides a deeper understanding of player impact, illustrating how data is beautiful in its depth.

Q7: Is there a cost associated with using NBA Season Leaders?

A7: Access to core NBA Season Leaders functionality (viewing current and historical leaderboards for points, assists, and rebounds) is often available for free, particularly if it's part of a larger sports news or statistics platform. However, some advanced features, deeper analytics, or ad-free experiences might be offered as part of a premium subscription. Check the specific platform's terms of service for details.

Q8: Can I download or export the data from the leaderboards?

A8: Many robust data tools offer export functionalities. Look for icons or buttons labeled "Export," "Download," or "Share Data." These features typically allow you to download selected leaderboard data into formats like CSV (for spreadsheets) or PDF, which is useful for personal analysis, reporting, or sharing NBA insights.

Q9: How does the tool ensure the accuracy of its NBA statistics?

A9: The NBA Season Leaders tool typically sources its basketball data directly from official NBA league sources or reputable, verified sports data providers. This ensures a high level of accuracy and reliability in the presented statistics. Regular updates and rigorous data validation processes are usually in place.

These FAQs aim to cover common inquiries, helping users to maximize their experience with the NBA Season Leaders tool and confidently navigate the world of NBA player performance data.

Conclusion: Mastering NBA Performance with Data-Driven Insights

In the fast-paced, ever-evolving landscape of professional basketball, understanding who stands out and why is paramount. The NBA Season Leaders tool offers a clear, authoritative, and incredibly useful lens through which to view the pinnacles of individual player performance. By centralizing and meticulously presenting the top players in points, assists, and rebounds across every NBA season, it transforms what could be a daunting task of data aggregation into an engaging and insightful experience.

This resource empowers a diverse community—from the most dedicated sports analysts and fantasy basketball managers to the casual fan who simply appreciates excellence on the court. It provides the essential data points needed for informed decisions, compelling discussions, and a deeper appreciation of the game's finest talents. The meticulous organization and intuitive design ensure that the wealth of information is not only accurate but also easily accessible, embodying the principle that data is beautiful when it's presented with clarity and purpose.

Leveraging NBA Season Leaders means gaining a strategic advantage, whether you're evaluating a player's consistency over time, identifying breakout stars, or simply satisfying a curiosity about who truly dominated a particular season. It's a testament to how well-structured information can elevate engagement and understanding in the vibrant world of NBA basketball.