Unveiling Global Congestion: Exploring the World’s Most Densely Populated Countries

Population Density by Country

Population Density by Country Header Image

Unveiling Global Congestion: Exploring the World’s Most Densely Populated Countries

From bustling mega-cities to compact island nations, the way humanity distributes itself across the Earth's surface tells a profound story of resource allocation, societal development, and geographical limitations. Understanding where people live, and how concentrated they are, offers critical insights into some of the most pressing global challenges and opportunities.

For anyone fascinated by human settlement patterns, global geography, and demographic trends, the concept of population density is fundamental. It's a metric that cuts through the noise of total population figures, revealing the true intensity of human presence in a given area. But where in the world are these human concentrations most extreme? Which countries truly stand out on the global map for their sheer number of inhabitants per square kilometer?

This is precisely where the "Population Density by Country" tool becomes an invaluable resource. Designed for clarity and insight, this tool provides a meticulously curated list highlighting the top 10 most densely populated countries in the world, offering a window into the unique demographic landscapes that shape our planet. Whether you're a student of geography, a data enthusiast who believes data is beautiful, a researcher, or simply a curious mind exploring world maps, this comprehensive resource promises to deepen your understanding of global population dynamics.

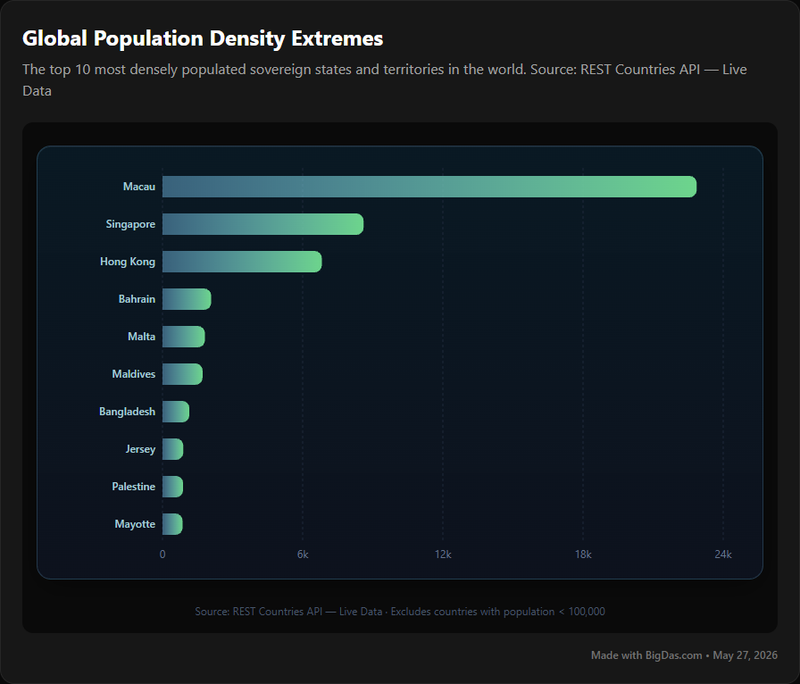
Population Density by Country Chart

What is Population Density by Country?

At its core, population density is a simple yet powerful geographical measurement: it quantifies the average number of people per unit of area, typically expressed as inhabitants per square kilometer or square mile. This metric helps us understand how "crowded" a place is, regardless of its total population size. A country with a large total population might not be densely populated if it has vast landmass, while a small country with a relatively smaller population can be incredibly dense.

The "Population Density by Country" tool is an online resource specifically designed to identify and present the top 10 most densely populated countries in the world. It’s more than just a list; it’s a snapshot of global demographic extremes, presented in an accessible and informative format. The tool aggregates recent and reliable data to ensure that users are presented with up-to-date figures, allowing for accurate comparative analysis and a clear understanding of where human populations are most concentrated globally.

Unlike a simple search engine query, this specialized tool focuses solely on providing this particular ranking with contextual information, making it a go-to for quick, verified insights into this specific geographical and demographic phenomenon. It serves as a starting point for deeper exploration into the factors contributing to high population density in these specific nations.

Why Population Density Matters

Understanding population density is crucial for several reasons:

  • Resource Management: High density places significant strain on natural resources such as water, land, and energy. It influences urban planning, infrastructure development, and environmental conservation efforts.
  • Economic Development: Densely populated areas often become economic hubs, fostering innovation and commerce, but can also face challenges like unemployment and housing shortages.
  • Social Dynamics: Density can impact social interactions, community structures, and the provision of public services like healthcare and education.
  • Environmental Impact: High concentrations of people often lead to increased pollution, habitat loss, and carbon emissions, making sustainable planning paramount.
  • Geopolitical Understanding: Demographic pressures can influence national policies, international relations, and regional stability.

By spotlighting the top 10 countries, the tool emphasizes regions where these challenges and opportunities are most pronounced, offering a unique perspective on global trends.

Key Features & Benefits of the Population Density by Country Tool

The "Population Density by Country" tool is engineered for clarity, accuracy, and ease of use, making complex demographic data readily accessible. Its features and benefits are tailored to assist a wide range of users in their pursuit of geographical and demographic knowledge.

Core Features:

  • Curated Top 10 Ranking: The primary feature is a clearly presented, up-to-date list of the top 10 most densely populated countries in the world. This eliminates the need for users to sift through vast datasets or complex statistical reports.
  • Accurate & Updated Data: The tool sources its information from reputable global demographic databases, ensuring that the population density figures are as current and accurate as possible, reflecting recent census data and demographic projections.
  • Essential Contextual Information: Beyond just the density number, the tool provides additional, crucial data points for each country, such as:
    • Total Population: To differentiate density from overall size.
    • Land Area (e.g., in sq km): To demonstrate the physical space available.
    • Geographical Location/Region: To provide a map-based understanding.
  • Clear and Intuitive Interface: Designed for readability, the tool presents information in a clean, uncluttered format, often utilizing tables or simple visualizations that make comparing countries straightforward. This commitment to design ensures that the data is beautiful and easy to digest.
  • Educational Summaries (Hypothetical): For each country in the top 10, the tool might include brief summaries explaining the historical, economic, or geographical factors contributing to its high population density, adding layers of educational value.

Key Benefits:

  • Enhanced Geographical & Demographic Understanding: Gain a rapid and precise understanding of global population distribution patterns and the challenges faced by nations with extreme density. It transforms abstract numbers into tangible insights.
  • Time-Saving Research Aid: Quickly obtain verified data on the most densely populated nations without having to cross-reference multiple sources. This is particularly beneficial for students, researchers, and journalists on tight deadlines.
  • Facilitates Comparative Analysis: The clear presentation allows for immediate comparison between countries, highlighting differences and similarities in their demographic profiles and geographical constraints.
  • Educational Resource: Offers an excellent learning aid for students studying geography, demography, social studies, and environmental science. Educators can use it to introduce concepts and spark discussions.
  • Informs Decision-Making: Provides foundational data for professionals in urban planning, public policy, environmental management, and humanitarian aid who need to understand population pressures.
  • Sparks Curiosity and Exploration: For the general public, the tool serves as an engaging entry point into global demographics, encouraging further exploration of different countries and their unique stories. It makes data is beautiful truly resonate by presenting compelling facts clearly.
  • Visualizes Global Trends (Potentially with Maps): By focusing on specific countries, the tool inherently helps users visualize these trends on a mental (or actual) map, connecting abstract numbers to real-world locations.

By combining accurate data with an accessible presentation, the "Population Density by Country" tool stands out as an indispensable asset for anyone seeking to unravel the complexities of human geography and population distribution.

Step-by-Step Guide on How to Use the Population Density by Country Tool

The "Population Density by Country" tool is designed for ease of access and immediate comprehension. While the specific interface might vary, the general steps to effectively utilize this valuable resource remain consistent. This guide will walk you through accessing the data and interpreting the insights it offers.

Step 1: Accessing the Tool

  1. Navigate to the Tool: Open your web browser and go to the specific URL where the "Population Density by Country" tool is hosted. This might be a dedicated webpage on a statistics portal, a geography educational site, or a specialized data visualization platform.
  2. Locate the Main Display: Upon arrival, you should immediately see the core feature of the tool: the list of the top 10 most densely populated countries in the world. This will likely be presented in a clear table format, often ranked from highest to lowest density.

Step 2: Understanding the Interface and Data Presentation

The tool prioritizes clarity. You will typically find the following columns or data points for each country listed:

  • Rank: The numerical position of the country based on its population density (1st being the most dense).
  • Country Name: The official name of the nation.
  • Population Density (per sq km): The primary metric, indicating the average number of people inhabiting each square kilometer of land. This is the core data point the tool highlights.
  • Total Population: The overall number of inhabitants in the country. This helps put the density figure into perspective, showing whether high density is due to a small area or a massive population.
  • Land Area (sq km): The total geographical size of the country, which is crucial for calculating density.
  • Region/Continent: Often included to provide a broader geographical context, allowing you to see regional patterns in density.

Step 3: Interpreting the Data and Drawing Insights

Once you have the list in front of you, you can begin to extract valuable information:

  1. Identify the Extremes: Immediately see which countries hold the top spots. Consider why these specific nations might be so densely populated. Is it due to small land area (e.g., city-states) or incredibly high populations within a relatively confined space?
  2. Compare and Contrast:
    • Look at countries with similar population density figures. Are they geographically close? Do they share similar economic or historical backgrounds?
    • Compare a country with high density but a relatively small total population (like a city-state) with a country that has high density and a very large total population. This distinction highlights different types of demographic pressures.
  3. Consider Geographical Context: Use the "Land Area" and "Region" data to visualize these countries on a mental (or actual) map. How does their physical geography contribute to their density? Are they islands, small coastal nations, or landlocked territories with limited arable land?
  4. Look for Trends: While the tool primarily presents a snapshot, observing the list can prompt questions about global trends. Are certain continents overrepresented in the top 10? What might this signify?
  5. Leverage Additional Information (if available): If the tool provides brief country summaries or links to more detailed profiles, take advantage of these to delve deeper into specific factors influencing each nation's population density. This might include information on urbanization rates, economic drivers, or environmental challenges.

Step 4: Deeper Exploration (Optional)

The "Population Density by Country" tool serves as an excellent starting point. To truly appreciate the data is beautiful aspect and its implications:

  • Cross-Reference with Maps: Open a world map or an online atlas and locate each of the top 10 countries. Visually understanding their size and position enhances the meaning of their density figures.
  • Research Contributing Factors: For a country that particularly intrigues you, conduct further research into its history, geography, economic policies, and cultural factors that have shaped its population distribution.
  • Observe Changes Over Time (if applicable): While this tool focuses on a current snapshot, understanding that these rankings can shift over time adds another layer to your geographical understanding.

By following these steps, you can harness the full power of the "Population Density by Country" tool to gain insightful and accurate knowledge about global demographic patterns, making complex data accessible and meaningful.

Why You Need This Tool: Crucial Use Cases for Population Density by Country

The "Population Density by Country" tool is far more than a simple list; it's a gateway to understanding critical global dynamics. Its specialized focus and clear presentation make it indispensable for a variety of individuals and professional fields. Here’s why you need this tool:

1. For Students & Educators (Geography, Social Studies, Demography)

  • Learning Aid: Provides a quick, authoritative reference for geography lessons, helping students grasp the concept of population density and see real-world examples.
  • Research & Projects: Students can easily identify case studies for projects on urbanization, resource management, or human geography.
  • Sparking Discussion: Educators can use the top 10 list to initiate discussions on the causes and consequences of high population density, connecting data to socio-economic and environmental issues.
  • Visualizing Data: The clear presentation makes abstract numbers tangible, especially when used in conjunction with maps, illustrating how data is beautiful when clearly presented.

2. For Researchers & Academics (Sociology, Environmental Science, Urban Planning)

  • Quick Data Verification: A reliable source for rapidly confirming the population density of top-ranking countries for comparative studies or background research.
  • Identifying Research Foci: Helps pinpoint regions experiencing extreme demographic pressures, guiding deeper investigations into their specific environmental, social, or infrastructural challenges.
  • Comparative Analysis: Essential for studies comparing urban development, public health outcomes, or resource consumption across highly dense versus sparsely populated areas.
  • Demographic Trend Analysis: Provides a foundational dataset for analyzing long-term shifts in global population distribution and predicting future trends.

3. For Journalists & Writers (News, Travel, Documentary)

  • Fact-Checking & Context: Ensures accurate population density figures are used in articles, reports, or documentaries about global geography, demographics, or specific countries.
  • Story Inspiration: The list itself can serve as inspiration for articles exploring the unique cultures, challenges, and innovations found in the world’s most crowded places.
  • Data-Driven Narratives: Helps weave compelling narratives by providing concrete data that illustrates the realities of life in highly dense nations, making complex statistics accessible to a broad audience.
  • Travel Planning & Understanding: Travelers can gain a deeper appreciation for the destinations they visit by understanding their demographic context and how population density might shape daily life.

4. For Policy Makers & Urban Planners

  • Informing Development Strategies: Provides crucial insights for developing sustainable urban planning, infrastructure projects, and housing policies in areas facing high population concentration.
  • Resource Allocation: Helps assess potential strains on public services, utilities, and natural resources in densely populated countries, informing strategic resource allocation.
  • Environmental Impact Assessment: Highlights regions where human activity is most concentrated, guiding efforts in environmental protection, pollution control, and climate change mitigation strategies.
  • International Relations & Aid: Offers valuable context for understanding the socio-economic pressures in different nations, informing foreign policy decisions and humanitarian aid efforts.

5. For Curious Minds & Global Citizens

  • Expanding World Knowledge: Satisfy your curiosity about the world's geography and human settlement patterns. It's an easy way to learn fascinating facts about different countries.
  • Understanding Global Challenges: Gain a clearer picture of some of the fundamental challenges faced by nations around the globe, from housing shortages to environmental pressures.
  • Appreciating Diversity: Recognize the diverse ways human societies adapt to varying geographical and demographic conditions, fostering a greater appreciation for global diversity.
  • Engaging with Maps: Encourages interaction with world maps to visualize the presented data, bringing data is beautiful to life in a geographical context.

In essence, the "Population Density by Country" tool is a powerful and accessible resource that transforms raw demographic data into actionable insights, serving as an essential starting point for anyone looking to understand the intricate relationship between people, space, and the planet.

Frequently Asked Questions (FAQ) About Population Density by Country

To further enhance your understanding and address common queries, here’s an FAQ section regarding population density and the "Population Density by Country" tool.

Q1: What exactly is population density and how is it calculated?

A1: Population density is a measure of the number of people living per unit of area, typically per square kilometer (sq km) or square mile. It is calculated by dividing the total population of a region by its total land area. Formula: Population Density = Total Population / Total Land Area

Q2: Why is population density an important metric?

A2: Population density is crucial because it provides insights into how concentrated human populations are, irrespective of a country's total population size. It helps understand:

  • Strain on resources (water, food, land, energy).
  • Need for infrastructure and public services (housing, transport, healthcare).
  • Potential for environmental impact and pollution.
  • Economic and social dynamics within a region.
  • Challenges and opportunities for urban planning and sustainable development.

Q3: How does the "Population Density by Country" tool determine the "top 10"?

A3: The tool aggregates the latest available and most reliable demographic data from reputable international sources (e.g., UN, World Bank, national statistical agencies). It then calculates or verifies the population density for all countries and presents the ten with the highest figures, ranked in descending order.

Q4: Does the tool account for uninhabitable land (e.g., deserts, mountains)?

A4: Generally, standard population density calculations use the total land area of a country, which includes uninhabitable regions. This can sometimes skew the perception of actual lived density, especially for very large countries with vast undeveloped areas. While this tool primarily uses the standard calculation for consistency across countries, understanding this nuance is important for deeper analysis. Some specialized demographic tools might offer "effective density" calculations, but this tool aims for broad, comparable figures.

Q5: How often is the data in the "Population Density by Country" tool updated?

A5: The frequency of updates depends on the tool's maintenance and the availability of new global demographic data. Typically, such tools are updated annually or biannually to reflect new census results, population estimates, and changes in land area (though the latter is rare). The tool aims to provide the most current data possible.

Q6: What's the difference between a high total population and high population density?

A6: These are distinct concepts:

  • Total Population: The absolute number of people living in a country. China and India have extremely high total populations.
  • Population Density: The number of people per unit of land area. A small country like Monaco can have a relatively low total population but an extremely high population density due to its tiny land area. Conversely, a large country like Canada has a significant total population but a very low density because of its vast landmass. The tool focuses specifically on the latter.

Q7: Can I rely on this data for academic or professional research?

A7: Yes, the "Population Density by Country" tool is designed to be a reliable and authoritative source for quickly accessing the top 10 most densely populated countries. The data is sourced from credible international bodies, making it suitable for initial research, comparative studies, and educational purposes. For highly specialized research, always cross-reference with primary statistical reports and consult the source methodologies.

Q8: What kind of geographical insights can I gain from this tool?

A8: Beyond just numbers, the tool allows you to:

  • Identify regions of the world where human concentration is most intense.
  • Understand the relationship between land size, total population, and density.
  • See if certain geographical characteristics (e.g., island nations, small coastal states) correlate with high density.
  • Visualize these countries on a global map to gain a spatial understanding of demographic pressures.
  • Appreciate how data is beautiful when it helps tell a story about our planet's human geography.

By addressing these common questions, the "Population Density by Country" tool aims to provide a comprehensive and valuable resource for anyone interested in global demographics and geography.

Conclusion: Decoding Our Crowded Planet with Precision

The "Population Density by Country" tool offers a precise and compelling lens through which to view one of the most fundamental aspects of human geography: how we distribute ourselves across the planet. By meticulously curating and presenting the top 10 most densely populated countries in the world, this resource goes beyond mere statistics, offering profound insights into the intricate relationship between population, land, and societal development.

For students, educators, researchers, policymakers, and anyone with a keen interest in global affairs, understanding population density is not an academic exercise but a practical necessity. It illuminates the unique challenges and innovative solutions emerging from regions where human life is most concentrated. From the demands on infrastructure and resources to the vibrant cultural tapestries woven in compact spaces, the data presented by this tool provides a critical starting point for deeper inquiry.

The value of this tool lies in its commitment to clarity, accuracy, and accessibility. It translates complex demographic data into an easily digestible format, allowing users to quickly grasp the global landscape of human concentration. Whether you're exploring world maps to visualize these densities or delving into the figures for a research project, the "Population Density by Country" tool empowers you with reliable information, fostering a more informed and nuanced understanding of our shared planet and its diverse human geography. It stands as a testament to the fact that when presented thoughtfully, data is beautiful and profoundly insightful.