
Prison Population by Country

Overview
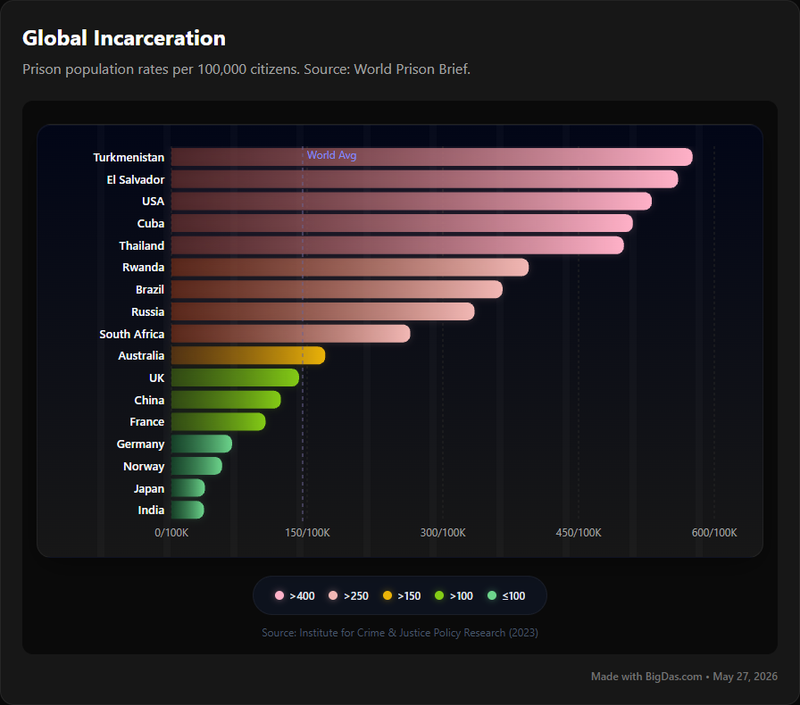
The Prison Population by Country tool presents incarceration rates per 100,000 people for selected nations. It centralizes data that is otherwise scattered across national reports and fragmented international databases, giving researchers, policymakers, journalists, and the public a direct way to compare how different countries approach detention.
What the Tool Does
The tool displays the incarceration rate per 100,000 people for a selection of countries. By standardizing the metric this way, it accounts for population size, so a small country and a large one can be compared on equal terms. Instead of calculating ratios from raw totals, users get a normalized figure ready for analysis.
The tool answers basic questions: How many people are held in prison relative to population? Which countries have the highest or lowest rates? How do different regions compare?
Key Features
Standardized Metric
The rate per 100,000 people is the unit used throughout. This removes the distortion of raw counts and makes cross-national comparison straightforward.
Multi-Country Selection
Users can select several countries at once and view their rates side by side. For example, selecting the United States, Germany, Japan, and Rwanda shows how four very different justice systems produce different outcomes.
Sorting and Filtering
Results can be sorted from highest to lowest rate, filtered by region, or browsed alphabetically.
Visualizations
Bar charts and other graphics translate the numbers into immediately readable formats. A bar chart makes it obvious which countries sit at the top and bottom of the list.
Source and Methodology Notes
The tool indicates where the data comes from, what year it covers, and how "incarceration" is defined (for example, whether it includes pre-trial detainees or juveniles).
Data Export
The displayed data can typically be downloaded as CSV or Excel for further analysis.
How to Use the Tool
1. Open the tool. The landing page usually shows a default set of countries or global averages.
2. Select countries. Use the search bar or dropdown to add countries. Multiple selections populate a comparison table or chart.
3. Read the figures. Each country shows a rate per 100,000 people and the year the data was collected. Check the year, as older figures may not reflect current policy.
4. Adjust the view. Sort by rate, filter by region, or switch between chart types.
5. Check the source. Look for the data source, year, and definitions before drawing conclusions.
6. Export if needed. Download the data for custom analysis.
Who Uses It
Researchers and Academics
Comparative criminology, policy analysis, and dissertations all benefit from a single source of standardized rates. Comparing countries with similar economies but different legal frameworks can highlight the effect of specific policies.
Policymakers and Government Officials
Justice departments can benchmark their country's rate against regional and global averages. Officials evaluating reforms can look at the outcomes of similar policies elsewhere before implementing changes.
Journalists
The tool provides international context for local crime stories and a reliable source for fact-checking claims about incarceration. Outlier rates can also serve as starting points for investigative work.
Students and Educators
Courses in criminology, sociology, international relations, and human rights can use the data to illustrate global disparities. Comparing rates in class often leads to productive discussion about the purpose of punishment.
Human Rights Organizations
High or rapidly rising rates can flag countries where detention conditions or justice systems warrant closer attention. The data also supports advocacy and long-term monitoring.
General Public
Anyone curious about how their country compares can use the tool without statistical training.
Frequently Asked Questions
What does "incarceration rate per 100,000 people" mean?
It is the number of people held in prison per 100,000 residents. A country with 1 million people and 1,000 prisoners has a rate of 100 per 100,000. The metric normalizes for population, so countries of different sizes can be compared directly.
Where does the data come from?
Sources typically include national statistical offices, government departments, and international bodies such as the World Prison Brief (Institute for Criminal Policy Research) and the UN Office on Drugs and Crime. The tool should cite its sources so users can verify them.
How often is the data updated?
Update frequency depends on the country and the source. Annual updates are common, but some countries release figures less often. The tool should always display the year of the data.
What causes differences in prison populations between countries?
Several factors drive variation:
- Legal systems and sentencing: Different definitions of crime, sentencing guidelines, and the use of alternatives to incarceration.
- Law enforcement: Arrest rates, prosecutorial discretion, and policing intensity.
- Socio-economic conditions: Poverty, inequality, and unemployment correlate with crime and incarceration.
- Political context: Authoritarian governments may detain political opponents; corruption levels also matter.
- Cultural attitudes: Views on punishment versus rehabilitation differ by society.
- Drug policy: Strict drug laws significantly increase prison populations in many countries.
- Demographics: Age structure, gender, and ethnic composition affect crime rates and sentencing outcomes.
Can I download the data?
Most versions of the tool allow export to CSV or Excel. Look for a "Download" or "Export" button near the table or chart.
How should the data be used responsibly?
- Use context: Consider the legal, political, and economic conditions of each country before drawing conclusions.
- Check definitions: Confirm what "incarceration" includes, since definitions vary.
- Avoid causal claims: Correlation between high rates and other factors does not prove one causes the other.
- Cite the source: Acknowledge where the data comes from and note any known limitations.
- Stay objective: Present the numbers without sensationalism.
Does the tool distinguish between types of incarceration?
Detail varies. Some tools count only sentenced prisoners; others include pre-trial detainees, juveniles in adult facilities, or administrative detainees. The methodology section or FAQ should clarify the scope. This matters because a high rate may reflect lengthy pre-trial detention rather than high conviction rates.
Summary
The Prison Population by Country tool provides a standardized way to compare incarceration rates across nations. By presenting data per 100,000 people, it removes population bias and makes global comparisons accessible to anyone with an interest in crime, justice, or human rights. Researchers, policymakers, journalists, educators, and citizens can all use it to move beyond anecdote and engage with the actual figures.