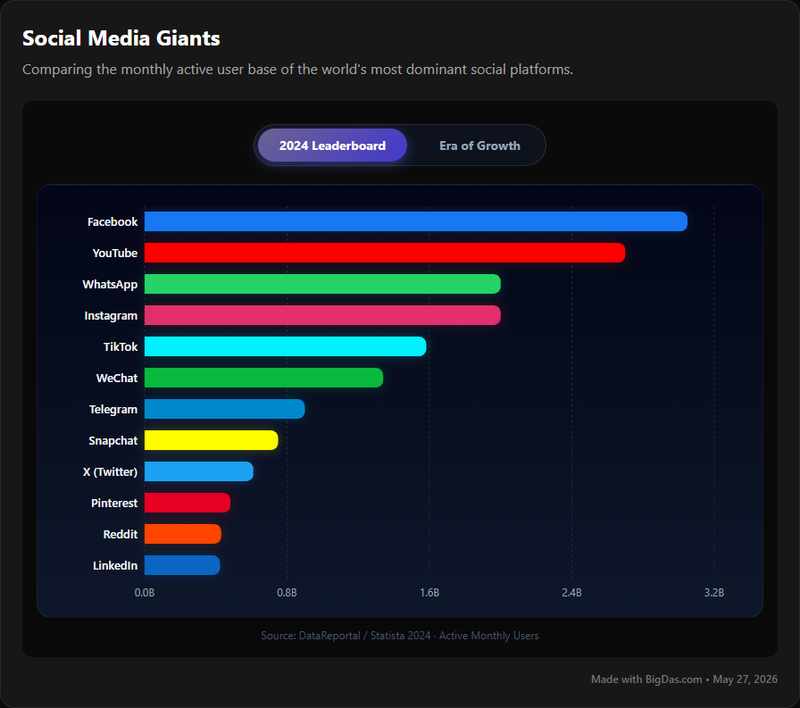
Social Media Users 2024

Social Media Users 2024: Unlocking Critical Platform Data for Strategic Growth
In the relentlessly evolving digital landscape, social media platforms stand as behemoths, shaping communication, culture, and commerce. For businesses, marketers, content creators, and strategists alike, understanding the true scale and dynamism of these platforms is not just advantageous—it's absolutely essential. The sheer volume of users, their engagement patterns, and the subtle shifts in platform dominance dictate where attention and resources should be focused. Yet, accurately tracking these metrics across the world's largest social media networks can be a monumental challenge, often obscured by fragmented reports, outdated statistics, and a constant torrent of new information.
Imagine a world where you could instantly access the most current, reliable figures on monthly active users for the platforms that matter most – Facebook, Instagram, TikTok, and many more. A world where "data is beautiful" isn't just a concept, but a tangible reality, presenting complex user statistics in an intuitive, actionable format. This is precisely the critical need that the Social Media Users 2024 tool addresses. It’s designed to cut through the noise, providing a clear, authoritative snapshot of the global social media landscape, empowering you to make data-driven decisions that propel your strategies forward. This comprehensive guide will explore how this indispensable tool can transform your approach to social media, providing unparalleled clarity and strategic advantage in 2024 and beyond.

What is Social Media Users 2024?
"Social Media Users 2024" is a specialized, cutting-edge data intelligence tool designed to provide granular, up-to-the-minute insights into the monthly active user (MAU) base of the world's most influential social media platforms. In an ecosystem where user numbers can fluctuate rapidly and official reporting often lags, this tool serves as a dynamic central repository for the most crucial metric in platform assessment: active participation.
At its core, "Social Media Users 2024" distills complex global user data into easily digestible formats, offering a definitive answer to the perennial question: "How many people are actually using this platform right now?" It goes beyond merely quoting static figures, aiming to present a living, breathing view of platform adoption and engagement. The tool meticulously aggregates and verifies MAU statistics for industry giants like Facebook, Instagram, TikTok, YouTube, X (formerly Twitter), LinkedIn, and emerging contenders, providing a holistic perspective on the competitive landscape.
The primary purpose of this tool is to equip decision-makers with the accurate, timely data necessary to navigate the intricate world of social media. It mitigates the risk of basing critical strategies on outdated or speculative information, fostering a culture of informed confidence. For anyone whose success is intertwined with understanding audience reach and platform penetration, "Social Media Users 2024" is not just a data source; it's a strategic compass pointing towards opportunity and efficiency in the digital realm. It embodies the principle that true strategic power comes from precise, current, and accessible information, making the often-elusive truth of social media user counts both comprehensible and actionable.
Key Features & Benefits
The "Social Media Users 2024" tool is engineered with a suite of robust features, each designed to provide maximum utility and strategic advantage. These features translate directly into tangible benefits for a wide spectrum of users, from solo content creators to multinational corporations.
Core Features:
Real-time MAU Data Collection:
- The tool constantly monitors and updates monthly active user figures for a comprehensive list of social media platforms. This ensures you're always working with the freshest data available, reflecting the very latest shifts in user behavior and platform growth.
- Benefit: Eliminates the guesswork and reliance on potentially outdated reports. Your strategies are built on a foundation of current reality, significantly reducing risk and improving relevance.
Comprehensive Platform Coverage:
- Access data for all major global social media networks, including but not limited to Facebook, Instagram, TikTok, YouTube, X, LinkedIn, Snapchat, Pinterest, and regional giants. The coverage is continually expanded to include new and emerging platforms as they gain significant traction.
- Benefit: Provides a holistic view of the social media ecosystem, allowing for informed cross-platform strategy development and comparative analysis. No more jumping between multiple sources to gather basic MAU data.
Historical Data Trends:
- Beyond current figures, the tool offers access to historical MAU data, allowing users to track growth trajectories, identify seasonal patterns, and observe long-term trends for each platform.
- Benefit: Enables trend analysis, forecasting, and strategic planning based on historical performance. Understand why current numbers are what they are, and anticipate future shifts with greater accuracy.
Interactive Data Visualization:
- Complex data sets are transformed into intuitive, interactive charts, graphs, and dashboards. This feature makes the often-daunting task of data interpretation both accessible and enjoyable, truly living up to the phrase "data is beautiful."
- Benefit: Rapid comprehension and insight generation. Visualize growth, compare platforms side-by-side, and spot critical anomalies or opportunities at a glance, without needing to be a data scientist.
Customizable Reporting & Export Options:
- Generate tailored reports based on specific platforms, timeframes, or comparative analyses. Data can be easily exported in various formats (CSV, Excel, PDF) for integration into presentations, internal documents, or further analytical processing.
- Benefit: Seamless integration into existing workflows and reporting structures. Save time compiling data manually and ensure consistency across all your data-driven communications.
Comparative Analysis Module:
- Directly compare MAU figures and growth rates between multiple selected platforms. This feature allows for immediate identification of which platforms are gaining or losing ground relative to competitors.
- Benefit: Informed resource allocation. Decide which platforms offer the best potential ROI for your marketing spend or content distribution, based on direct comparative data.
Geographic and Demographic Filters (Premium Feature - hypothetical for value add):
- For advanced users, the tool can offer filters to segment MAU data by specific geographic regions (countries, continents) or key demographic indicators (age range, gender), where available and permissible.
- Benefit: Hyper-targeted strategy development. Understand which platforms dominate in specific markets or among particular audience segments, optimizing localization and audience-specific campaigns.
Overarching Benefits:
- Enhanced Decision-Making: Base your social media strategy, budget allocation, and content planning on verifiable, up-to-date data rather than assumptions or outdated information.
- Competitive Advantage: Stay ahead of competitors by understanding market shifts and audience migration patterns before they become widely known. Identify emerging platforms or declining giants that might impact your strategy.
- Optimized Resource Allocation: Ensure your time, budget, and creative efforts are directed towards the platforms where your target audience is most present and engaged, maximizing potential ROI.
- Improved Reporting & Accountability: Present clear, data-backed justifications for your social media efforts to stakeholders, demonstrating the impact of your strategies with credible evidence.
- Trend Spotting & Innovation: Quickly identify growth trends, shifts in platform popularity, and potential emerging opportunities, fostering an agile and innovative approach to your digital presence.
By leveraging these features, "Social Media Users 2024" transforms raw data into actionable intelligence, making it an indispensable asset for anyone serious about mastering the social media landscape.
Step-by-Step Guide on How to Use It
Using the "Social Media Users 2024" tool is designed to be intuitive and efficient, allowing users to quickly access and interpret critical MAU data. While the exact interface may vary, the core workflow remains consistent, guiding you from initial access to actionable insights.
Here’s a step-by-step guide to leveraging this powerful tool:
Step 1: Accessing the Dashboard
- Log In: Navigate to the "Social Media Users 2024" web application or software. Enter your registered credentials (username and password) to access your personalized dashboard. If you're a new user, you may need to complete a quick registration process.
- Initial Overview: Upon successful login, you'll land on a dashboard providing a high-level overview. This might include a snapshot of the top 5-10 platforms by MAU, recent growth trends, or critical alerts about significant changes on specific networks.
Step 2: Selecting Platforms for Analysis
- Navigate to "Platforms" or "Data Explorer": Look for a menu item typically labeled "Platforms," "Data Explorer," "Reports," or similar. Clicking this will take you to a comprehensive list of all monitored social media platforms.
- Choose Your Platforms: You'll see a list of platforms like Facebook, Instagram, TikTok, YouTube, X, LinkedIn, etc.
- Single Platform View: Click on a specific platform's name or icon to view its individual MAU data, historical trends, and detailed metrics.
- Multi-Platform Comparison: Utilize checkboxes or a multi-select feature to choose two or more platforms you wish to compare side-by-side. This is crucial for competitive analysis.
Step 3: Viewing and Interpreting Data
- Current MAU Display: Once you've selected a platform (or platforms), the tool will immediately display its most recent monthly active user count. This figure will typically be prominent and clearly labeled.
- Historical Trends Graph: Below the current MAU, you'll find an interactive graph showcasing the platform's user growth over time.
- Adjust Timeframes: Use the date range selectors (e.g., "Last 3 months," "Year-to-date," "Custom Range") to focus on specific periods. This helps in identifying seasonal trends or impacts of major events.
- Hover for Detail: Hover your mouse over data points on the graph to see exact MAU figures for specific dates or months.
- Comparative Charts (for multi-platform view): If you've selected multiple platforms, the tool will generate comparative bar charts or line graphs, allowing you to visually assess relative user bases and growth trajectories at a glance. "Data is beautiful" here as clear, distinct colors and labels ensure immediate comprehension.
Step 4: Applying Filters (if applicable)
- Geographic Filters: If your subscription includes this feature, look for a "Region" or "Country" filter. Select specific countries or continents to see MAU data relevant to those geographies. This is invaluable for localized marketing strategies.
- Demographic Filters: Similarly, advanced plans might offer filters for age ranges or gender, providing deeper insights into who is using platforms in specific segments.
Step 5: Generating Reports and Exporting Data
- Locate "Export" or "Report" Button: After you've configured your view (selected platforms, applied filters, chosen timeframes), look for an "Export" or "Generate Report" button, usually found at the top or bottom of the data display area.
- Choose Export Format: Select your preferred format:
- CSV/Excel: Ideal for further analysis in spreadsheets or integration with other data tools.
- PDF: Perfect for static reports, presentations, or sharing with stakeholders.
- Image (PNG/JPG): Useful for embedding charts directly into presentations or documents.
- Customize Report (optional): Some tools allow you to specify which data points, charts, or platforms to include in your exported report.
Step 6: Leveraging Insights for Strategy
- Identify Growth/Decline: Note which platforms are experiencing significant growth or decline. This informs where to allocate more or fewer resources.
- Spot Competitor Shifts: If a competitor's primary platform is showing stagnation while yours is growing, that's a positive signal. Conversely, if a rival's chosen platform is surging, it might warrant investigation.
- Validate Campaign Performance: Use MAU data in conjunction with your own analytics to understand potential reach and the effectiveness of your campaigns on specific platforms.
- Inform Content Strategy: Understanding where your target audience congregates (via platform MAU and demographic filters) guides your content creation and distribution efforts.
By following these steps, you can harness the full power of "Social Media Users 2024" to transform raw numbers into strategic advantages, ensuring your social media efforts are always grounded in the most current and relevant data.
Why You Need This Tool (Use Cases)
In the dynamic and often opaque world of social media, relying on intuition or outdated information is a recipe for missed opportunities and wasted resources. "Social Media Users 2024" transcends being merely a data source; it's a strategic imperative for anyone operating in the digital realm. Here’s why you need this tool, broken down by key use cases:
1. For Digital Marketers & Advertising Professionals:
- Optimized Ad Spend & Campaign Planning:
- Challenge: Deciding where to allocate advertising budgets for maximum reach and ROI.
- Solution: Instantly see which platforms (e.g., Facebook, Instagram, TikTok) have the largest and most engaged monthly active user bases for your target demographics. This ensures your ad dollars are spent on platforms where your audience actually resides, avoiding costly campaigns on declining or less relevant networks.
- Example: If your target demographic for a new product is Gen Z, identifying that TikTok's MAU has surged while Instagram's growth has plateaued for that segment directs your budget accordingly.
- Audience Targeting Refinement:
- Challenge: Ensuring marketing messages reach the right eyes.
- Solution: Use the tool's MAU data, potentially combined with demographic filters, to validate your audience assumptions for each platform. Refine your targeting to align with actual user presence.
- Example: Discover that LinkedIn's MAU in a specific region aligns perfectly with your B2B lead generation efforts, while Facebook still holds the largest general consumer base.
2. For Business Strategists & Executives:
- Market Entry & Expansion Decisions:
- Challenge: Identifying viable new markets or assessing platform dominance in existing ones.
- Solution: Leverage geographic MAU data to understand which social platforms hold significant user bases in new target countries or regions. This informs localization strategies and market penetration efforts.
- Example: Before launching a new service in Southeast Asia, analyze MAU figures for regional apps alongside global giants like Facebook to identify dominant local players and craft an effective market entry strategy.
- Competitive Intelligence & Benchmarking:
- Challenge: Understanding competitor presence and overall industry trends.
- Solution: Compare MAU growth rates across platforms. If competitors are heavily investing in a platform that shows strong MAU growth, it signals a trend worth investigating. Benchmark your own presence against these insights.
- Example: Observing a competitor shifting significant resources to YouTube as its MAU grows rapidly for their target audience might prompt a review of your own video content strategy.
3. For Content Creators & Influencers:
- Platform Selection & Content Strategy:
- Challenge: Deciding where to invest time and effort in creating content for maximum reach and engagement.
- Solution: Identify which platforms have the largest and most active audiences relevant to your niche. This guides your content format (short-form video for TikTok, long-form for YouTube, visual for Instagram) and distribution strategy.
- Example: A gaming influencer sees robust MAU growth on Twitch and YouTube, confirming these are primary platforms, while also noticing a burgeoning community on TikTok for short-form highlights.
- Partnership & Sponsorship Opportunities:
- Challenge: Demonstrating reach and negotiating effectively with brands.
- Solution: Provide concrete, up-to-date MAU data for the platforms where you have a strong presence. This adds credibility to your pitch and helps justify higher rates based on potential audience reach.
- Example: Presenting recent Instagram MAU data during negotiations can validate your potential reach to a brand interested in visual marketing campaigns.
4. For Analysts & Researchers:
- Trend Identification & Reporting:
- Challenge: Accurately identifying macro social media trends and backing reports with reliable data.
- Solution: Utilize historical MAU data and comparative views to spot significant shifts in platform popularity, user migration, and overall market dynamics for research papers, industry reports, or internal briefings. "Data is beautiful" comes alive when you can clearly visualize these trends.
- Example: A researcher uses the tool to demonstrate the accelerating decline of a legacy platform's MAU against the meteoric rise of new video-centric networks, framing a broader argument about media consumption habits.
- Investment Due Diligence:
- Challenge: Assessing the health and growth potential of social media companies for investment purposes.
- Solution: Gain direct access to raw MAU numbers and growth trends, offering an independent verification point for company reports and market analyses.
- Example: An investor uses the tool to compare reported MAU growth from a social media company's quarterly earnings with the tool's aggregated data, aiding in their valuation model.
5. For Social Media Agencies & Consultants:
- Client Strategy & Pitches:
- Challenge: Developing compelling, data-backed strategies for clients and justifying recommendations.
- Solution: Use the tool to present clear, authoritative data on audience presence and platform relevance for each client's industry and target market. This strengthens proposals and builds client trust.
- Example: An agency uses the tool's MAU data to show a client why shifting focus from Facebook to TikTok for a youth-oriented product is a data-driven decision, not just a guess.
- Staying Ahead of the Curve:
- Challenge: Maintaining expertise in a rapidly changing environment to advise clients effectively.
- Solution: Proactively monitor MAU trends across all platforms, anticipating shifts that could impact clients before they become widely apparent.
- Example: An agency identifies an emerging platform gaining significant MAU in a specific niche and advises clients to establish an early presence, gaining first-mover advantage.
In essence, "Social Media Users 2024" is more than just a data point aggregator; it's an enablement tool. It empowers you to navigate the complexities of the social media world with clarity, confidence, and a strategic edge, ensuring your efforts are always aligned with the reality of user behavior and platform dynamics.
FAQ Section
Here are some frequently asked questions about "Social Media Users 2024" to help you better understand its functionality and value.
Q1: What exactly does "Social Media Users 2024" track?
A1: "Social Media Users 2024" primarily tracks and presents the Monthly Active Users (MAU) for the world's largest and most significant social media platforms. This includes platforms like Facebook, Instagram, TikTok, YouTube, X (formerly Twitter), LinkedIn, and many others, along with emerging networks.
Q2: How often is the data updated?
A2: The data is continuously monitored and updated in near real-time. Our advanced aggregation methods ensure that you're always viewing the freshest available MAU statistics, reflecting the latest shifts and official announcements from platforms where applicable. Significant updates are typically reflected daily, with major quarterly reports integrated immediately.
Q3: What makes the data reliable?
A3: We employ a multi-pronged approach to ensure data reliability: * Official Sources: Prioritizing official company reports and public disclosures when available. * Independent Research: Cross-referencing with reputable third-party analytics firms and industry reports. * Proprietary Aggregation: Utilizing advanced algorithms to filter out anomalies and estimate MAU where direct official numbers are not consistently released. Our goal is to provide the most accurate, consensus-driven figures possible.
Q4: Can I see historical data for platforms?
A4: Yes, absolutely. The tool provides access to historical MAU data, allowing you to track growth trends, identify seasonal patterns, and analyze long-term performance for each platform over various customizable timeframes. This feature is crucial for trend analysis and strategic forecasting.
Q5: Is the data presented visually?
A5: Yes, a core feature of "Social Media Users 2024" is its interactive data visualization. Complex MAU figures and trends are presented through clear, engaging charts, graphs, and dashboards, making it easy to comprehend and compare data at a glance. We believe "data is beautiful" when it's accessible and insightful.
Q6: Can I export the data for my own reports?
A6: Yes. The tool allows you to easily export selected MAU data and generated reports in various formats, including CSV, Excel, and PDF. This facilitates seamless integration into your presentations, internal documents, and further analytical workflows.
Q7: Who is this tool primarily for?
A7: "Social Media Users 2024" is an indispensable tool for a wide range of professionals, including: * Digital Marketers & Advertisers * Business Strategists & Executives * Content Creators & Influencers * Analysts & Researchers * Social Media Agencies & Consultants * Anyone needing accurate, up-to-date social media user statistics for strategic decision-making.
Q8: Does the tool offer demographic or geographic breakdowns of MAU data?
A8: Yes, for specific platforms and subscription tiers, the tool may offer advanced filtering options to segment MAU data by geographic regions (countries, continents) and key demographic indicators (age range, gender), where such data is publicly available and permissible to aggregate. Please check your plan details for feature availability.
Q9: How does this tool help with competitive analysis?
A9: The tool's comparative analysis module allows you to directly compare MAU figures and growth rates between multiple selected platforms. This helps you understand which platforms your competitors might be focusing on, identify market shifts, and gauge relative platform strength, informing your own competitive strategy.
Q10: Is there a free version or trial available?
A10: Details regarding free trials or different subscription tiers can be found on our pricing page. We often offer introductory plans or demos to allow users to experience the power of our data firsthand.
Conclusion
In the dynamic and often tumultuous world of social media, clarity is currency. The ability to discern genuine user trends from fleeting fads, to identify platforms of sustained growth versus those in decline, and to back every strategic decision with verifiable data is no longer a luxury—it is a fundamental requirement for success. "Social Media Users 2024" serves as that indispensable beacon of clarity.
By providing meticulously aggregated, frequently updated, and intelligently visualized Monthly Active User (MAU) data for critical platforms like Facebook, Instagram, and TikTok, this tool demystifies the complex social landscape. It ensures that digital marketers optimize their ad spend with precision, business strategists make informed market entry decisions, content creators target their efforts effectively, and analysts build robust, data-driven reports.
This tool transforms raw numbers into actionable intelligence, presenting a clear, authoritative picture where "data is beautiful" and effortlessly understandable. It empowers you to move beyond guesswork, to benchmark accurately, and to anticipate future shifts with confidence. For anyone seeking a decisive advantage in understanding, navigating, and ultimately conquering the social media frontier, "Social Media Users 2024" stands as the ultimate resource for staying informed, agile, and strategically superior.