Charting the Cosmic Ascent: How 'Space Launches Per Year' Illuminates the Rocket Revolution (2010-2024)

Space Launches Per Year

Space Launches Per Year Header Image

Charting the Cosmic Ascent: How 'Space Launches Per Year' Illuminates the Rocket Revolution (2010-2024)

The dawn of the 21st century has ushered in an unprecedented era of space exploration and commercialization. What was once the exclusive domain of government agencies has now become a vibrant, multi-faceted ecosystem, bustling with private enterprises, technological breakthroughs, and ambitious missions. From the initial forays of commercial ventures to the stunning innovations in reusable rocket technology, the pace of orbital space launches has accelerated dramatically. This rapid evolution presents both exhilarating opportunities and a challenge for anyone trying to grasp the sheer scale of activity unfolding above us.

How many rockets have pierced the atmosphere in a given year? What are the underlying trends driving this surge? And how has a company like SpaceX fundamentally reshaped the landscape? Answering these questions requires more than just anecdotal observations; it demands precise, accessible data.

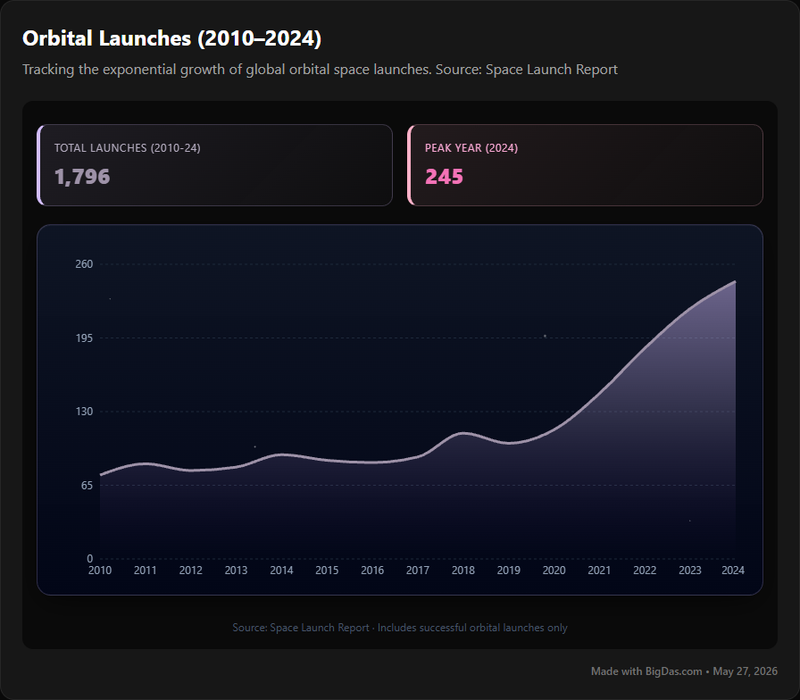
Enter "Space Launches Per Year," a sophisticated and intuitive tool designed to demystify the complex narrative of orbital launch frequency from 2010 to 2024. For analysts, enthusiasts, journalists, and educators alike, this platform offers a singular vantage point to witness the trajectory of human ambition beyond Earth. It transforms raw numbers into compelling insights, making the story of our journey to the stars not just understandable, but truly captivating. This is where data is beautiful, transforming intricate statistics into clear, actionable understanding of the cosmos.

Space Launches Per Year Chart

What is Space Launches Per Year?

"Space Launches Per Year" is a dedicated, interactive data visualization platform that meticulously tracks and presents the frequency of orbital space launches on an annual basis, spanning from 2010 through 2024. Far more than just a simple count, this tool serves as a dynamic historical archive, designed to illuminate the ebb and flow of global space activity over a critical period of unprecedented growth and transformation.

At its core, the tool aggregates verified data on every successful (and sometimes unsuccessful) attempt to send a payload into Earth's orbit, or beyond, within the specified timeframe. It distills complex information from various international space agencies, private launch providers, and industry reports into a user-friendly interface. The primary objective is to provide a clear, concise, and accurate representation of the pace at which humanity is venturing into space, offering a longitudinal perspective that highlights significant shifts and milestones.

The selection of the 2010-2024 timeframe is deliberate and strategically important. This period encapsulates the pivotal moments that have redefined the space industry. It begins just as the first wave of commercial space companies began to seriously challenge the traditional government-led paradigm, and extends into the present day, showcasing the maturation of this commercial sector. This era has witnessed the rise of major players like SpaceX with its revolutionary Falcon 9 and Starship programs, the sustained efforts of national space programs from the USA, Russia, China, and Europe, and the emergence of new nations and private entities in the launch market.

By focusing on "orbital space launch frequency," the tool provides a tangible metric for measuring global progress and investment in space technology. It inherently tracks not just the number of rockets, but indirectly, the underlying advancements in propulsion, manufacturing, and mission planning that enable these frequent ventures. It’s an essential resource for anyone seeking to understand the quantitative story behind the headlines of lunar missions, satellite deployments, and interstellar probes.

Key Features & Benefits

"Space Launches Per Year" isn't merely a data repository; it's an analytical powerhouse designed to bring clarity and depth to the understanding of global space activity. Its suite of features is tailored to provide comprehensive insights, while its inherent benefits empower users across various domains.

Core Features:

  • Interactive Historical Launch Data (2010-2024): The cornerstone of the tool, offering a comprehensive dataset of all orbital space launches within this pivotal period. Users can dynamically explore year-by-year totals, seeing the raw numbers come to life.
  • Intuitive Visualizations: Complex data is transformed into easily digestible charts and graphs. Expect clear line graphs showcasing annual trends, bar charts for comparative analysis, and potentially even heatmaps to highlight peak activity periods. This focus on visual clarity is where data is beautiful truly shines, making patterns immediately apparent.
  • Trend Analysis Capabilities: Beyond simple counts, the tool enables users to identify long-term trends, significant inflection points, and periods of accelerated or decelerated activity. Pinpoint precisely when the frequency of rockets launching began to dramatically increase.
  • Filtering and Segmentation Options: While the primary view is global, advanced filtering could allow users to segment data by:
    • Launch Provider: Track the individual contributions of entities like NASA, Roscosmos, CNSA, Arianespace, and critically, monitor the phenomenal growth of SpaceX.
    • Launch Site: See which spaceports are the busiest hubs of activity.
    • Country of Origin: Understand the national contributions to global launch frequency.
    • Mission Type (Inferred): While not explicitly stated, a robust tool might infer or categorize launches (e.g., commercial satellites, government missions, crewed flights) to add richer context.
  • Comparative Analysis Tools: Easily compare launch frequency between different years, providers, or regions side-by-side, facilitating deeper analytical insights.
  • Data Export Functionality: For users who wish to conduct their own external analysis, the ability to download raw or filtered data (e.g., CSV, Excel) is invaluable.
  • Regular Updates: Data for the current year (up to 2024) is updated frequently, ensuring that users always have access to the most recent information on space launches.

Unlocking the Benefits:

  • Unparalleled Clarity & Understanding: Demystifies the often-overwhelming volume of space activity, presenting it in an organized, comprehensible format. It moves beyond headlines to reveal the quantitative reality.
  • Informed Decision-Making: For investors, policymakers, and business strategists, understanding the growth trajectory of space launches is crucial for market analysis, resource allocation, and strategic planning. Witnessing the rise of commercial providers, particularly SpaceX, offers clear market signals.
  • Enhanced Research & Journalism: Provides researchers with a robust dataset for academic studies and journalists with verifiable statistics for compelling storytelling about the modern space race. Quickly verify claims about increasing launch rates.
  • Educational Empowerment: A phenomenal resource for students and educators, offering a tangible, interactive way to learn about the history and current state of space exploration. Visualize the impact of technological advancements on launch frequency.
  • Inspiring Curiosity for Enthusiasts: For anyone fascinated by space, the tool offers a unique way to track human progress, celebrate milestones, and witness the unfolding future of cosmic ventures. It makes the "data is beautiful" aspect tangible by showing the relentless drive towards the stars.
  • Benchmarking & Performance Tracking: Agencies and companies can use the tool to benchmark their own launch performance against industry trends or specific competitors.

In essence, "Space Launches Per Year" transforms raw numbers into a living narrative of humanity's evolving relationship with space. It’s not just about counting rockets; it’s about understanding the pulse of an entire industry.

Step-by-Step Guide on How to Use It

Navigating "Space Launches Per Year" is designed to be intuitive, allowing users from all backgrounds to quickly access and interpret the valuable data on orbital launch frequency. Here's a general guide on how to make the most of this powerful tool:

Step 1: Accessing the Platform

  • Navigate to the Tool: Open your web browser and go to the "Space Launches Per Year" website (e.g., www.spacelaunchesperyear.com).
  • Initial View: Upon loading, you'll typically be presented with an overview dashboard. This might feature a default graph showing the total number of space launches per year across the entire 2010-2024 period, giving you an immediate sense of the global trend.

Step 2: Exploring Global Launch Trends

  • Observe the Overview Graph: Take a moment to analyze the main visualization. Look for the overall trajectory – is it increasing, decreasing, or stable? Identify any noticeable spikes or dips in launch activity. This initial view is excellent for grasping the macro trend of rockets heading to space.
  • Hover for Details: Most interactive graphs allow you to hover your mouse over specific data points (e.g., a bar representing a year, or a point on a line graph). This action will usually reveal precise numerical data, such as "Total Launches in 20XX: YYY."

Step 3: Filtering and Refining Your View

  • Locate the Filters: On the dashboard, typically to the left, right, or top of the main visualization, you'll find a set of filtering options. These are your controls for drilling down into the data.
  • Filter by Year Range: While the tool covers 2010-2024, you might want to focus on a shorter period. Look for sliders or drop-down menus to adjust the start and end years for your analysis. For example, you might want to see only data from 2015 to 2020.
  • Filter by Launch Provider: This is often a crucial filter. Select specific organizations (e.g., "SpaceX," "NASA," "Roscosmos," "Arianespace," "CNSA") to see their individual contributions to the total launch count. This is particularly insightful for tracking the growth of private companies.
  • Filter by Country/Region (If available): If the tool offers this, you can narrow down the data to show launches originating from specific nations or geographical areas.
  • Apply Filters: After selecting your desired criteria, ensure you click an "Apply Filters" or "Update View" button if one is present, to refresh the data visualization.

Step 4: Comparing and Contrasting Data

  • Side-by-Side Views (If Supported): Some advanced versions of the tool might allow you to compare multiple entities simultaneously. For instance, you could select SpaceX and NASA to see their respective launch numbers plotted on the same graph, highlighting their different trajectories.
  • Interpreting Trends: Once you've applied your filters, pay attention to how the graphs change. Are certain providers growing faster than others? Are there specific years where one entity significantly outperformed or underperformed? This comparative analysis is where the real insights are gleaned.

Step 5: Utilizing Additional Features

  • Data Export: Look for an "Export Data" or "Download CSV" button, usually located near the visualization. This feature allows you to download the raw numerical data (based on your current filters) for further analysis in spreadsheet software.
  • Share Functionality: Many data tools offer options to share your specific filtered view or download an image of the chart directly to social media or presentations.
  • Help/Information Section: If you encounter any unfamiliar terms or wish to understand the data sources, check for a "Help," "About," or "FAQ" section within the platform.

By following these steps, you can harness the full potential of "Space Launches Per Year" to track the incredible journey of rockets and space exploration over the last decade and a half, turning complex numbers into understandable narratives. The beauty of this data lies in its accessibility and clarity, empowering you to become an informed observer of humanity's reach for the stars.

Why You Need This Tool (Use Cases)

The surge in space launches from 2010 to 2024 marks a pivotal era, characterized by innovation, increasing commercialization, and geopolitical competition. "Space Launches Per Year" is not just a collection of numbers; it's an indispensable lens through which to understand these profound shifts. Here’s why a diverse range of individuals and organizations will find this tool essential:

1. For Space Enthusiasts and the General Public: Discovering "Data is Beautiful"

  • Satisfying Curiosity: Ever wondered how many rockets launch in a month, or how rapidly the numbers are climbing? This tool provides definitive answers, making the sheer volume of space activity tangible.
  • Tracking Milestones: Witness the impact of groundbreaking companies like SpaceX as their launch cadence accelerates, revolutionizing access to orbit. See the data that backs up their phenomenal growth.
  • Understanding the Scope: Gain a clear, visual understanding of humanity's increasing presence in orbit, connecting abstract concepts to concrete statistics. It brings the awe of space down to earth through elegant visualizations.

2. For Researchers and Academics: Fueling Scholarly Inquiry

  • Trend Identification: Analyze long-term patterns in global launch frequency, identifying periods of significant growth, stagnation, or decline. This data is critical for studies on space industrialization, technological diffusion, and international relations.
  • Hypothesis Testing: Researchers can use the data to test hypotheses about the impact of specific technological advancements (e.g., reusable rockets), policy changes, or economic conditions on launch rates.
  • Quantitative Basis for Studies: Provides a robust, verifiable dataset for academic papers, presentations, and grant proposals related to the space economy, orbital debris, or strategic competition in space.

3. For Journalists and Media Professionals: Crafting Data-Driven Narratives

  • Fact-Checking and Verification: Quickly verify claims about increasing launch rates, market dominance by certain players (e.g., SpaceX), or the overall health of the space industry.
  • Story Angles and Visuals: Uncover compelling trends and patterns that can form the basis of news articles, documentaries, or infographics. The visualizations inherent in "Space Launches Per Year" are ready-made for media presentation, demonstrating how data is beautiful in storytelling.
  • Contextualizing Events: Put individual launch events into broader context by showing the cumulative activity over time, providing depth to reporting on specific missions or failures.

4. For Business Analysts and Investors: Navigating the New Space Economy

  • Market Intelligence: Understand the overall growth trajectory of the launch market. Identify peak periods and potential bottlenecks.
  • Competitive Analysis: Track the launch frequency of key players like SpaceX, ULA, Arianespace, Rocket Lab, and others. This offers insights into their operational capabilities, market share, and growth strategies.
  • Investment Decisions: For those investing in space-related companies, launch data is a critical indicator of industry health, demand for services, and the operational success of specific providers. A company with consistently high launch numbers indicates strong operational efficiency and market demand.
  • Strategic Planning: Companies entering or expanding within the space sector can use the data to inform their strategic planning, forecast demand for related services (e.g., satellite manufacturing, ground stations), and assess market viability.

5. For Educators and Students: An Engaging Learning Resource

  • Interactive Learning: Provides a dynamic and engaging way to teach about the history and future of space exploration, technological innovation, and global collaboration (or competition).
  • Project Data: Students can use the tool to gather data for science fair projects, research papers, or classroom presentations on topics like the impact of reusable rockets, the growth of the commercial space industry, or the changing landscape of international space agencies.
  • Visualizing Progress: Helps students visually grasp concepts like exponential growth, market disruption, and the rapid pace of technological advancement, making abstract statistics concrete and meaningful.

In essence, "Space Launches Per Year" bridges the gap between complex space industry data and accessible, actionable insights. Whether you're making critical business decisions, writing a compelling story, conducting academic research, or simply feeding your fascination with the cosmos, this tool is your definitive guide to the remarkable ascent of rockets and the evolving frontier of space.

FAQ Section

To further clarify the utility and scope of "Space Launches Per Year," here are answers to some frequently asked questions:


Q1: What exactly defines an "orbital space launch" in this tool?

A1: An orbital space launch refers to any successful or attempted mission where a rocket carries a payload (e.g., satellite, capsule, probe) with the intention of placing it into Earth orbit or sending it beyond Earth's gravitational influence into interplanetary space. Sub-orbital test flights or ballistic missile tests are generally not included unless they were part of a developmental program ultimately aiming for orbital capability and are explicitly categorized as such.


Q2: What data sources does "Space Launches Per Year" use?

A2: The tool aggregates data from a diverse range of reputable and verified sources. These typically include official reports from national space agencies (e.g., NASA, Roscosmos, CNSA, ESA, JAXA, ISRO), press releases and mission manifests from private launch providers (e.g., SpaceX, ULA, Arianespace, Rocket Lab), and established industry databases and space news aggregators known for their accuracy. Data is cross-referenced to ensure reliability.


Q3: How frequently is the data updated?

A3: For current years (like 2024), the data is typically updated on a weekly or bi-weekly basis, sometimes even daily following significant launch events. Historical data (2010-2023) is considered static and only updated if new, verified information emerges or corrections are required. The goal is to provide the most up-to-date and accurate picture of space launches.


Q4: Can I see launch data broken down by individual companies, like SpaceX?

A4: Yes, absolutely. One of the core features of "Space Launches Per Year" is the ability to filter data by launch provider. You can select specific companies or agencies, such as SpaceX, NASA, Roscosmos, Arianespace, ULA, Rocket Lab, and others, to see their individual launch frequency contributions over the 2010-2024 period. This helps in understanding individual entity performance and market share.


Q5: Why does the tool focus specifically on the 2010-2024 timeframe?

A5: This specific timeframe was chosen because it represents a transformative era in space exploration. It begins roughly when commercial space efforts started gaining significant traction and extends through the present, capturing the rapid acceleration of launch frequency, the rise of private companies, and the maturation of reusable rockets technology. It offers a focused yet comprehensive look at the modern space race and the "New Space" era.


Q6: Is it possible to export the data for my own analysis?

A6: Yes, the tool typically provides functionality to export the displayed data. You can usually download the filtered data in common formats such as CSV (Comma Separated Values) or Excel spreadsheets. This allows researchers, analysts, and students to perform their own in-depth calculations and visualizations.


Q7: Does the tool distinguish between different types of launches (e.g., crewed, satellite deployment)?

A7: While the primary focus is on total orbital launch frequency, a sophisticated version of the tool might offer an inferred categorization or limited filtering based on mission type where data is consistently available and verifiable (e.g., distinguishing between commercial satellite deployments, government scientific missions, or crewed flights). This adds further contextual depth to the raw numbers of rockets launched into space.


Q8: How can I interpret the visualized data to find trends?

A8: Look for sustained increases or decreases in launch numbers over several years (trends). Identify abrupt changes (spikes or dips) that might correlate with specific events (e.g., new rocket introduction like Falcon 9, major program funding shifts, geopolitical events). Comparing different entities (e.g., SpaceX vs. traditional agencies) can also reveal diverging or converging trends. The visual clarity makes identifying these patterns straightforward, embodying the idea that data is beautiful.


Conclusion: Understanding the Unprecedented Ascent to Orbit

The period from 2010 to 2024 stands as a testament to humanity's unwavering drive to reach beyond Earth. What began as a steady hum of activity has escalated into a crescendo of space launches, fundamentally altering our relationship with the cosmos. "Space Launches Per Year" serves as a crucial lens through which to comprehend this remarkable era.

This tool provides a clear, quantitative narrative of how the global space industry has evolved. It illustrates the profound impact of innovation, particularly the rise of commercial powerhouses like SpaceX and their pioneering reusable rockets, on the overall frequency of missions. For anyone observing the increasing numbers of satellites in orbit, the renewed focus on lunar exploration, or simply the sheer spectacle of a rocket launch, understanding the underlying data is key.

From researchers seeking robust historical datasets to journalists crafting compelling stories, and from investors analyzing market trends to enthusiasts simply appreciating the "data is beautiful" aspect of human endeavor, the platform offers profound insights. It distills a decade and a half of complex space activity into an accessible, interactive format, allowing users to not just see the numbers, but to truly understand the pulse of our push to the stars. The ability to track, analyze, and comprehend the trajectory of space launches is no longer a niche pursuit; it is a vital component of understanding our present and anticipating our future beyond Earth.